Gender pay gap reporting 2022 – our analysis of the latest results
17 April 2023
What do the latest set of gender pay gap reporting figures tell us? Employers had until 4 April 2023 to report their statistics for 2022. We’ve analysed the data to discover the trends.
We looked at this last year. This year, the data shows that employers generally have achieved a slight overall reduction in gender pay gaps, with small improvements in the proportion of women filling the senior and best-paid roles, but the pandemic is still influencing some of the results.
400 missing employers?
Last year, 9,872 employers published their gender pay gaps within the deadline, but the total number of reports subsequently rose to 10,527.
This year, 10,192 reported within the deadline. This means that there are probably around 300-400 still to publish. The EHRC has said that it will take enforcement action against those employers that have failed to report their gaps on time for 2 consecutive years, so some employers may face letters from the EHRC in the coming weeks and months. There are 149 employers who published late last year and are still to publish this year.
Enforcement of gender pay gap reporting is light touch, to say the least. EHRC enforcement action has, to date, been limited to the sending of letters and some naming and shaming. As we’ve written before, there’s uncertainty as to whether the EHRC has the legislative authority to impose fines. Although it is empowered to take action against Equality Act infringements, gender pay gap reporting obligations exist under a separate piece of legislation. The Regulations may have been made pursuant to the Equality Act, but they create no new powers for the EHRC.
Gender pay gaps in 2022
The trends of previous years have continued with employers, on average, seeing reductions in their mean and median pay gaps.
Mean change in mean and median pay gap
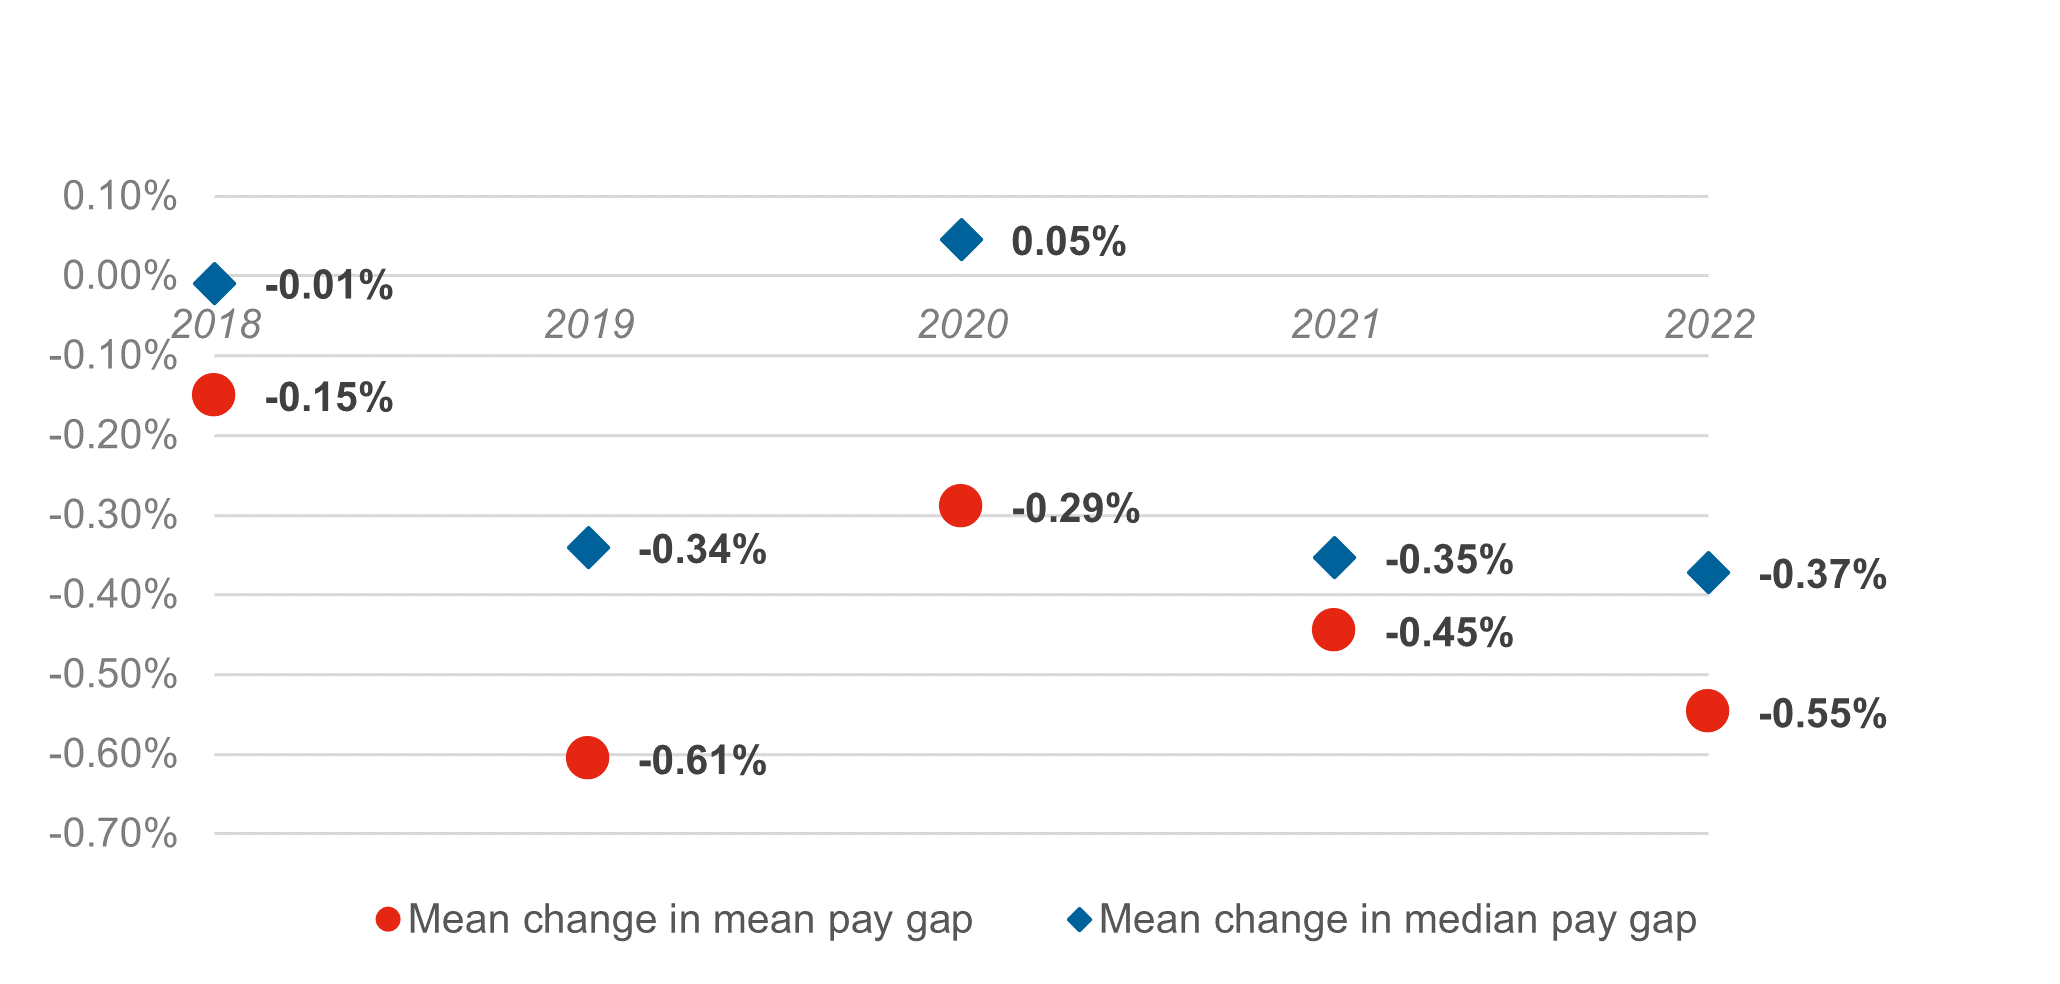
Overall, 87.6% of employers have positive mean pay gaps i.e. in favour of men. 79.5% have positive median pay gaps. Some employers have negative pay gaps i.e. in favour of women: 11.9% have negative mean pay gaps and 12.7% have negative median pay gaps.
There are 32 employers who have reported suspiciously “perfect” gaps with both 0% mean and median pay gaps. While 0% median pay gaps are not uncommon – 7.8% of employers have reported this and they can be common in the retail sector – 0% mean pay gaps are a statistical improbability; both being zero suggests problems in the calculations. If an employer had no women in the workforce, the methodology required by the Regulations means that “perfect” gaps like these are the inevitable result. However, in none of these 32 employers is this the case. Their quartiles show that there are women in their workforces and so there must be errors in their results.
Variation in gender pay gaps
Standard deviation is a measure of the amount of variability. The higher the amount, the more variable the data. The graph below shows the standard deviation for change in mean and median pay gaps.
Standard deviation of mean change in mean and median pay gap
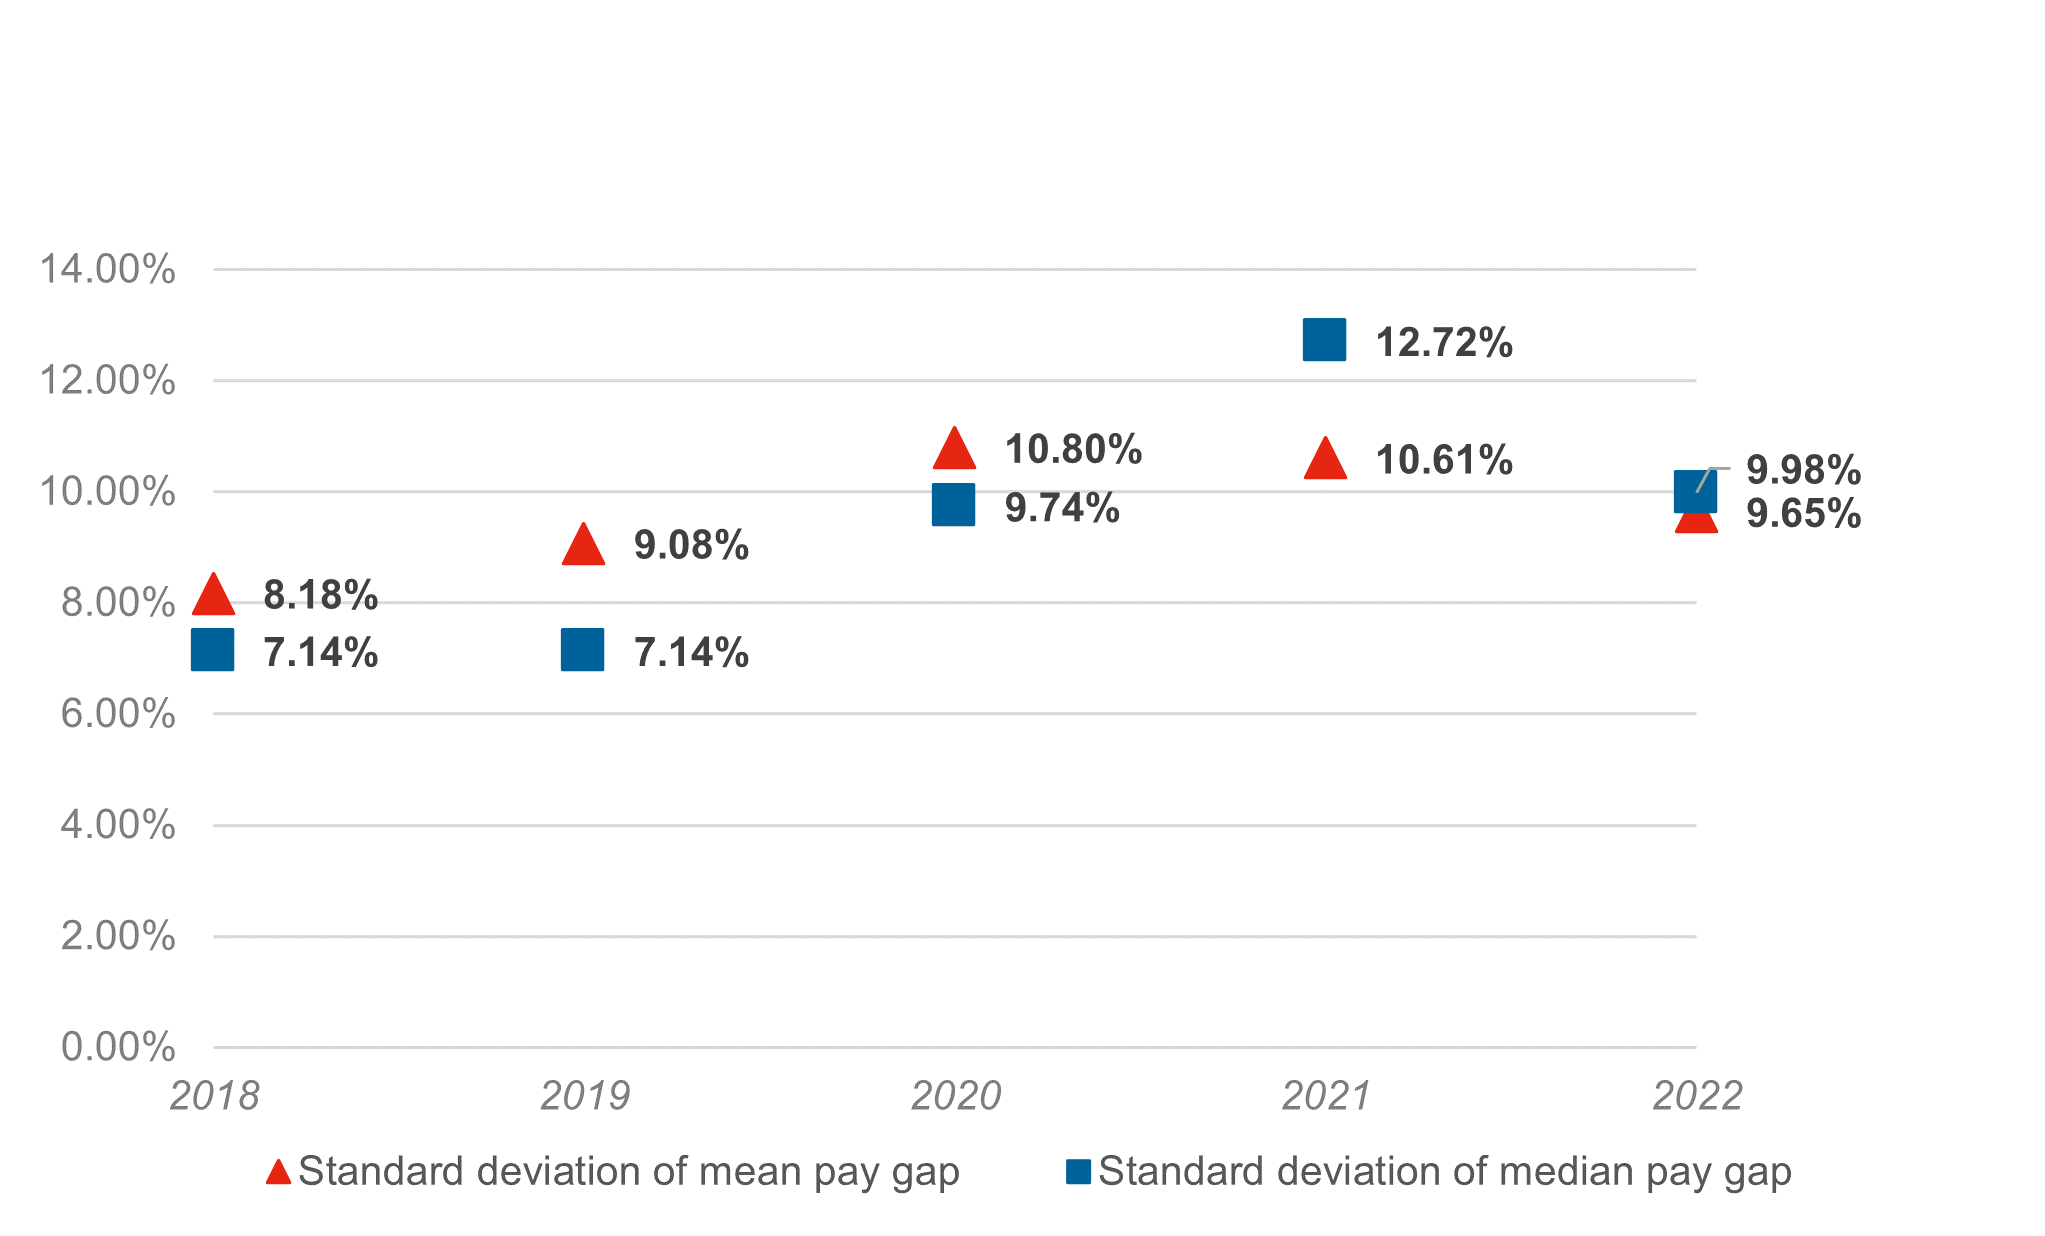
The amount of variation in this year’s statistics is a little less than last year. This might be due to fewer small employers choosing to voluntarily provide their gender pay gaps. In 2017 just 285 small employers reported their gaps and by last year this had risen to 517. However in 2022 this fell back to 429. As we’ve set out below, the smallest employers have the greatest variability in gaps and so, given that they are accounting for a greater proportion of the overall figures, they may be influencing the overall variability in the data.
Gender pay gaps by industry
All employers that report their gender pay gaps include one or more 5 digit “SIC codes”. This is a standardised way of classifying organisations. For example, the 5 digit code for “advertising agencies” is 73110. These 5 digit codes can be very granular so, for analytical purposes, they can be broadened out by taking only the first digits of that code. For example, “advertising agencies” sit within the broader 3 digit "group” code 731 (“advertising”) and the even broader 2 digit “division” code 73 (“advertising and marketing activities”). For our analysis, we looked at the 2 digit division level.
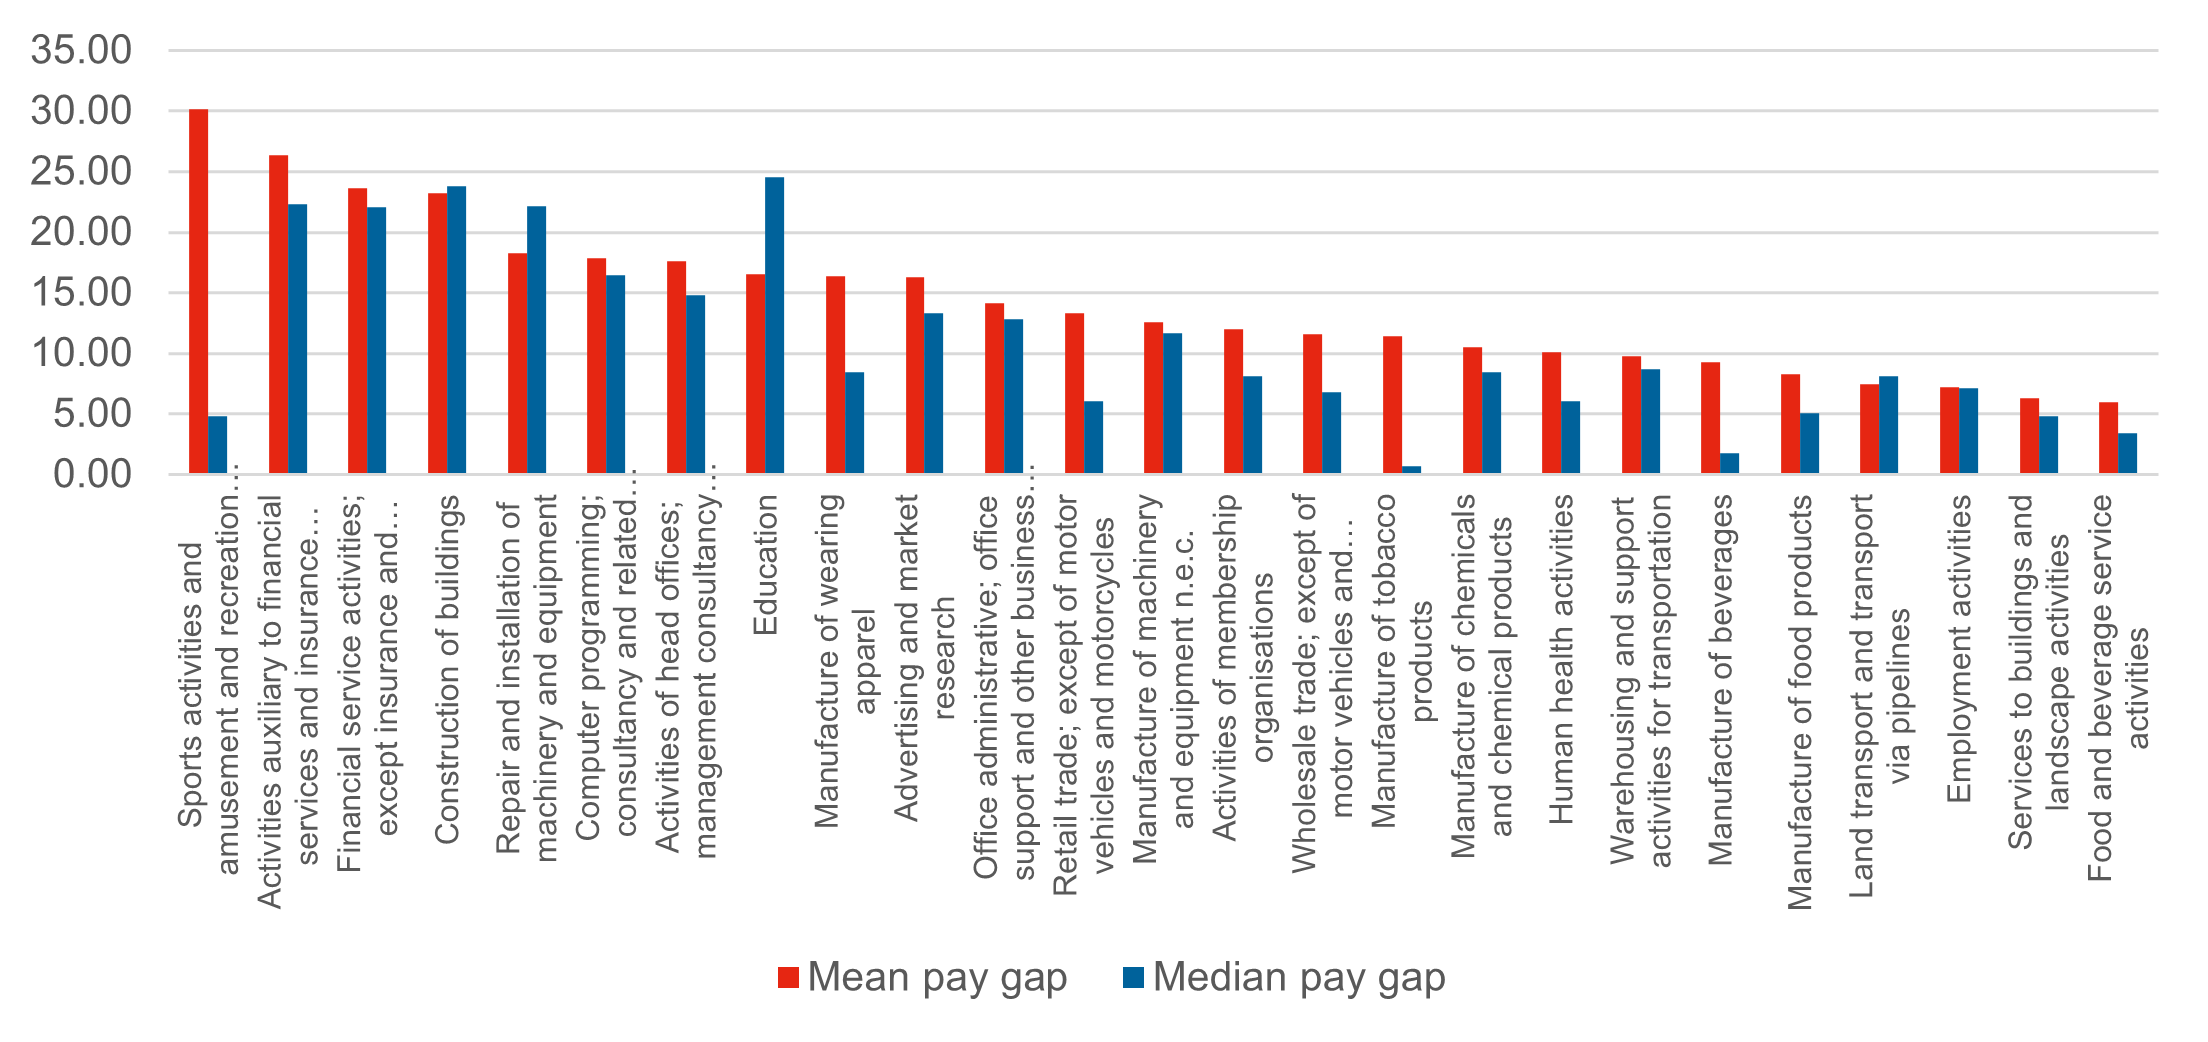
All sectors have gender pay gaps, showing that average pay for women is less than average pay for men. Sports activities had the biggest mean pay gaps on average in 2022 (which could be influenced by very highly-paid footballers on the men’s teams).
Other sectors with large gender pay gaps are financial services, construction and tech (included below in “computer programming”). Restaurants have the lowest gender pay gaps.
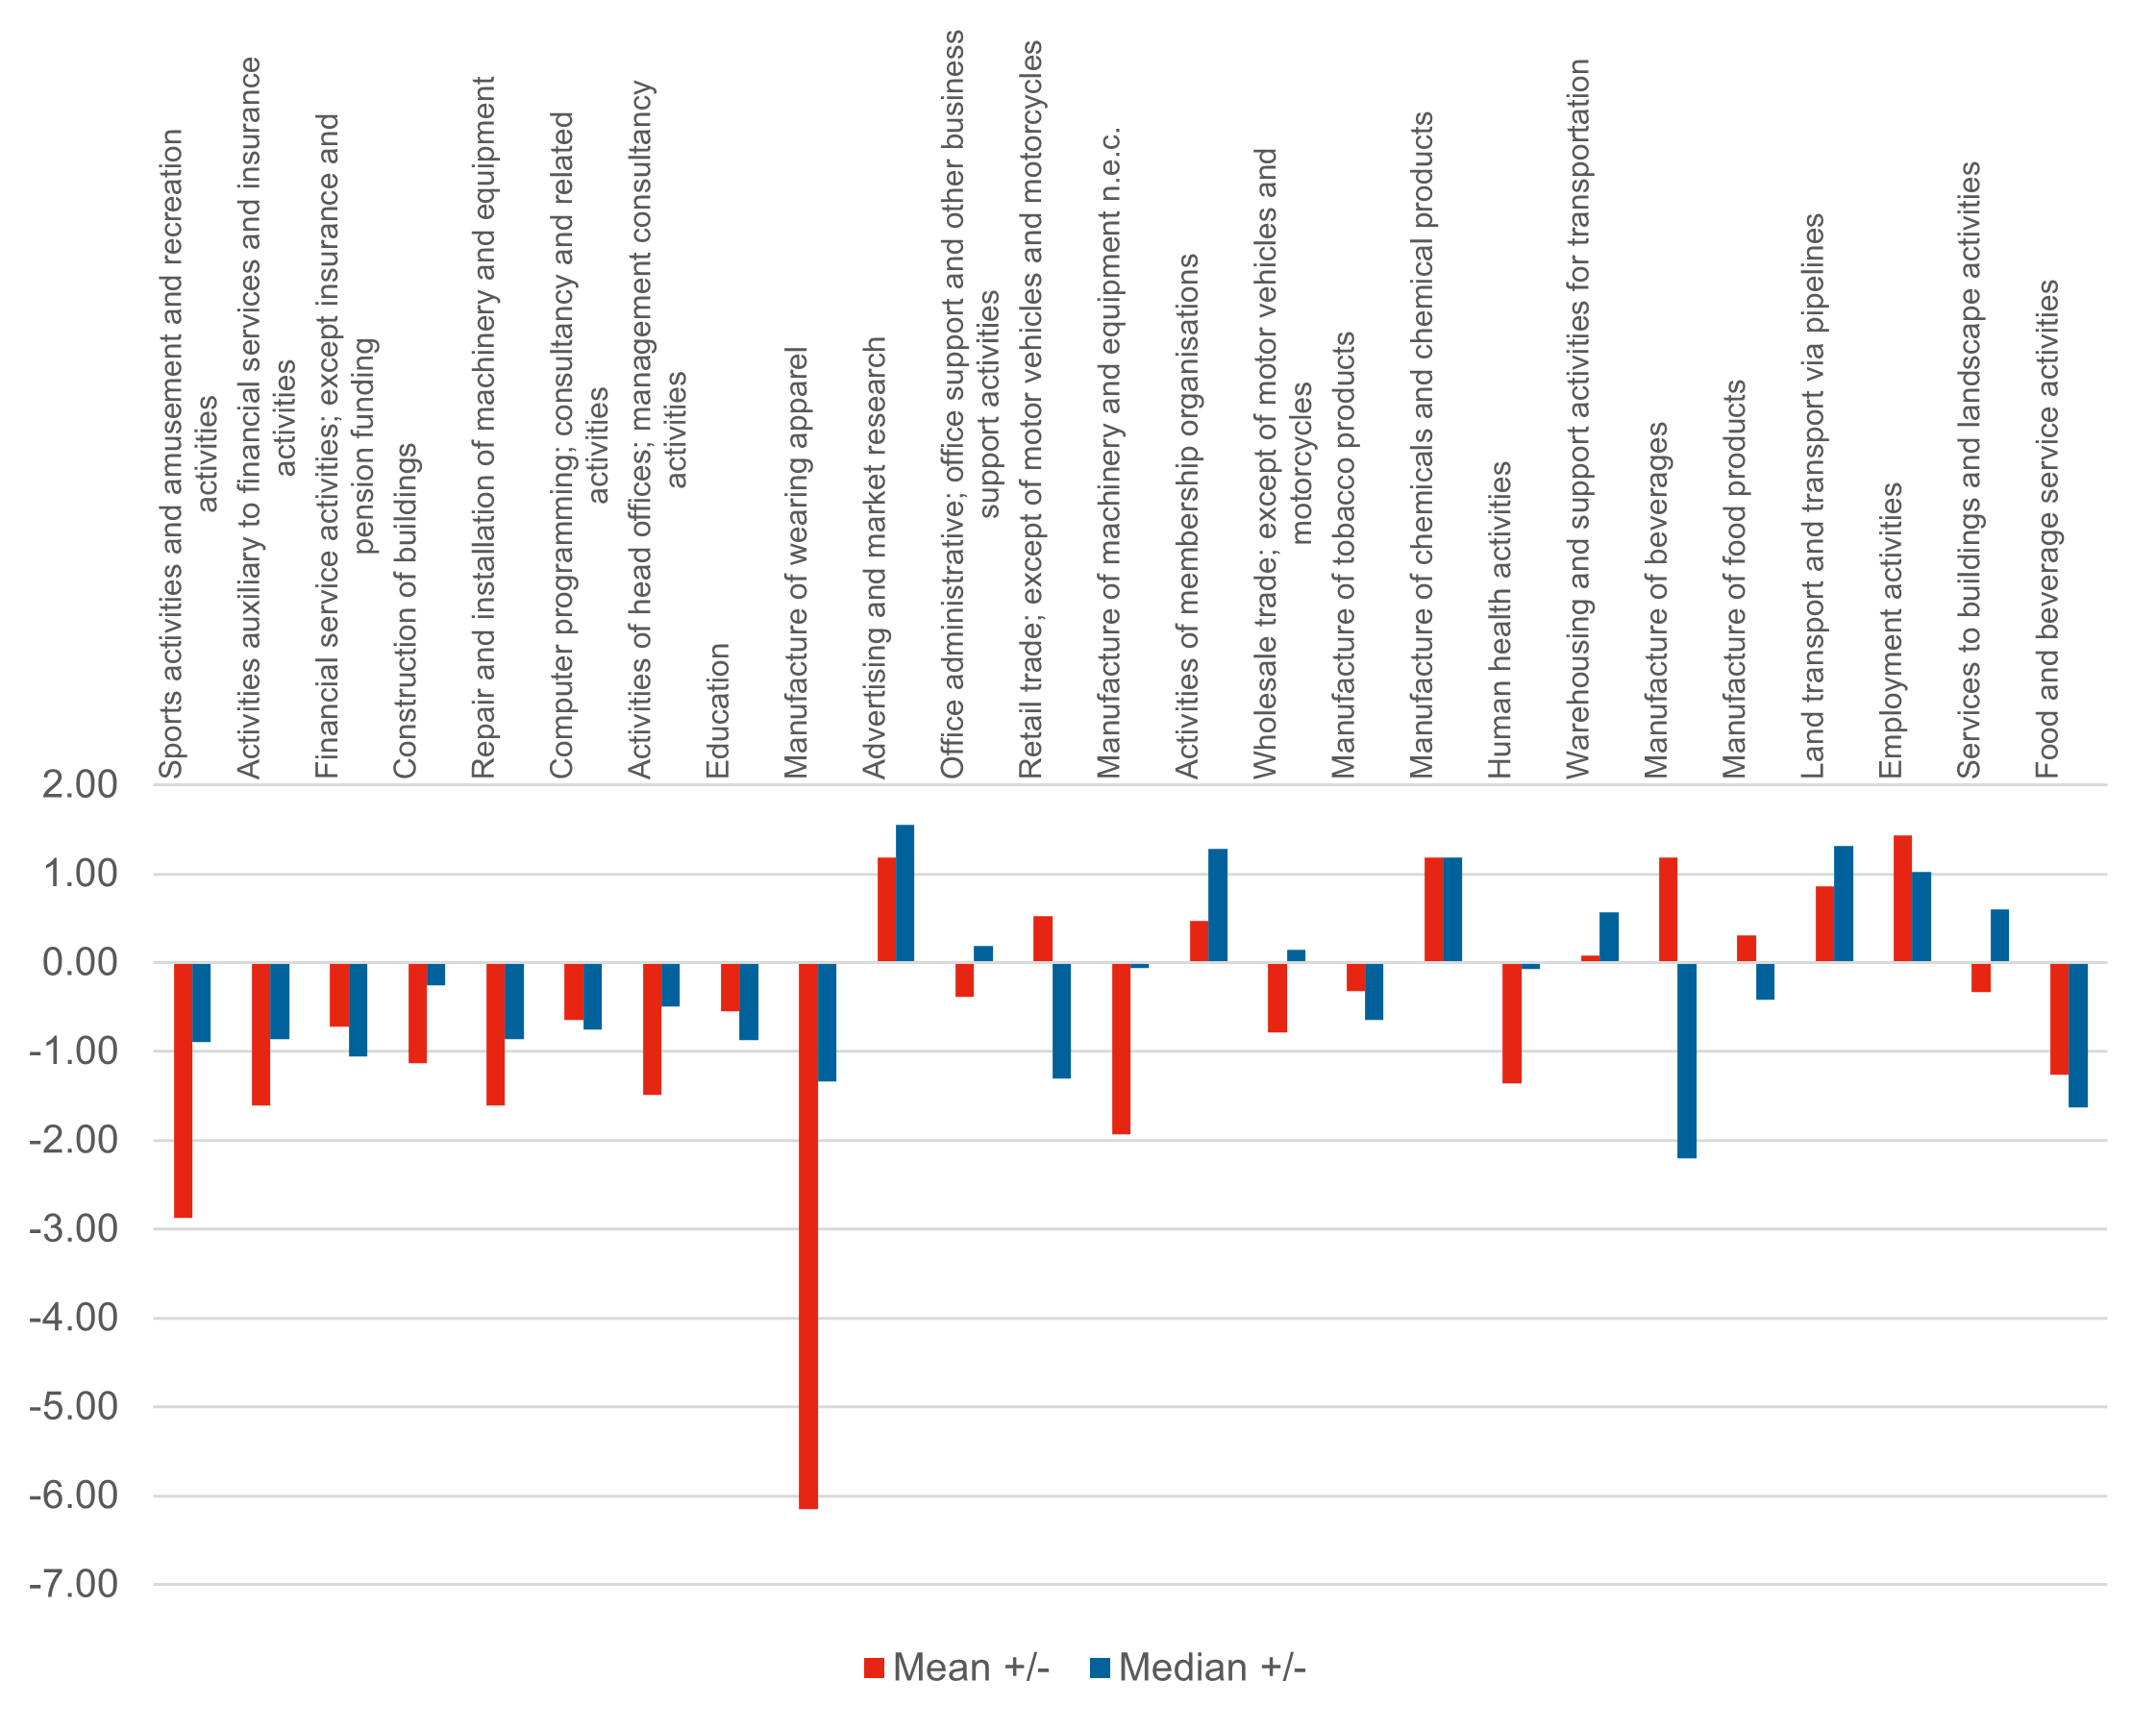
Most sectors have seen improvements in their gender pay gaps. Advertising is a notable exception with employers in this sector reporting mean and median gaps that are 1-2% higher than in 2021.
Mean and median gender pay gap by sector
Mean change in mean and median gender pay gap by sector
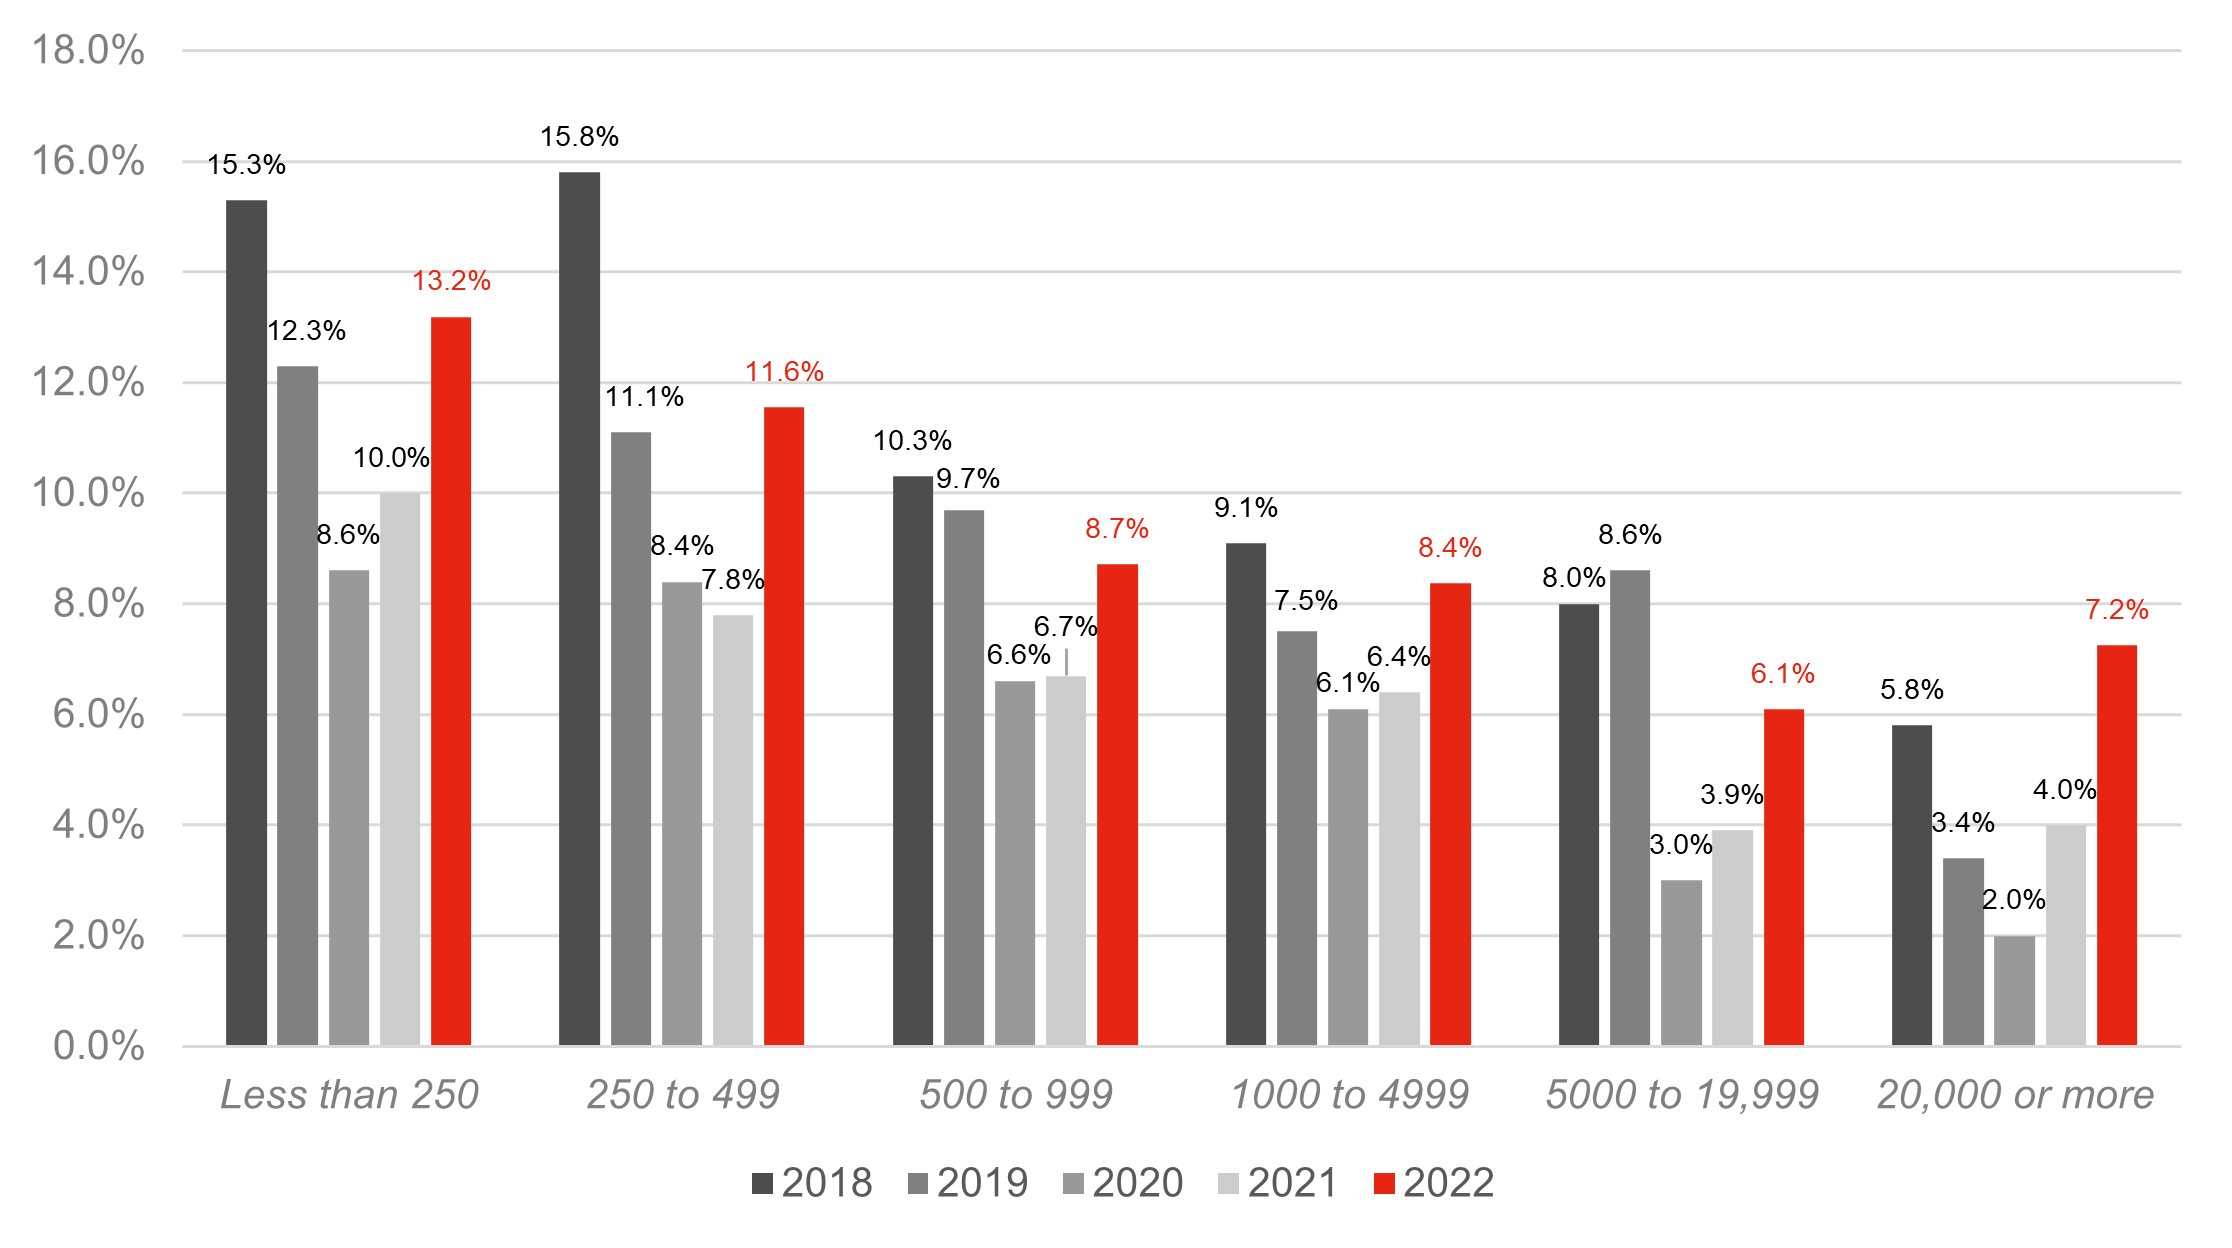
Gender pay gaps by company size
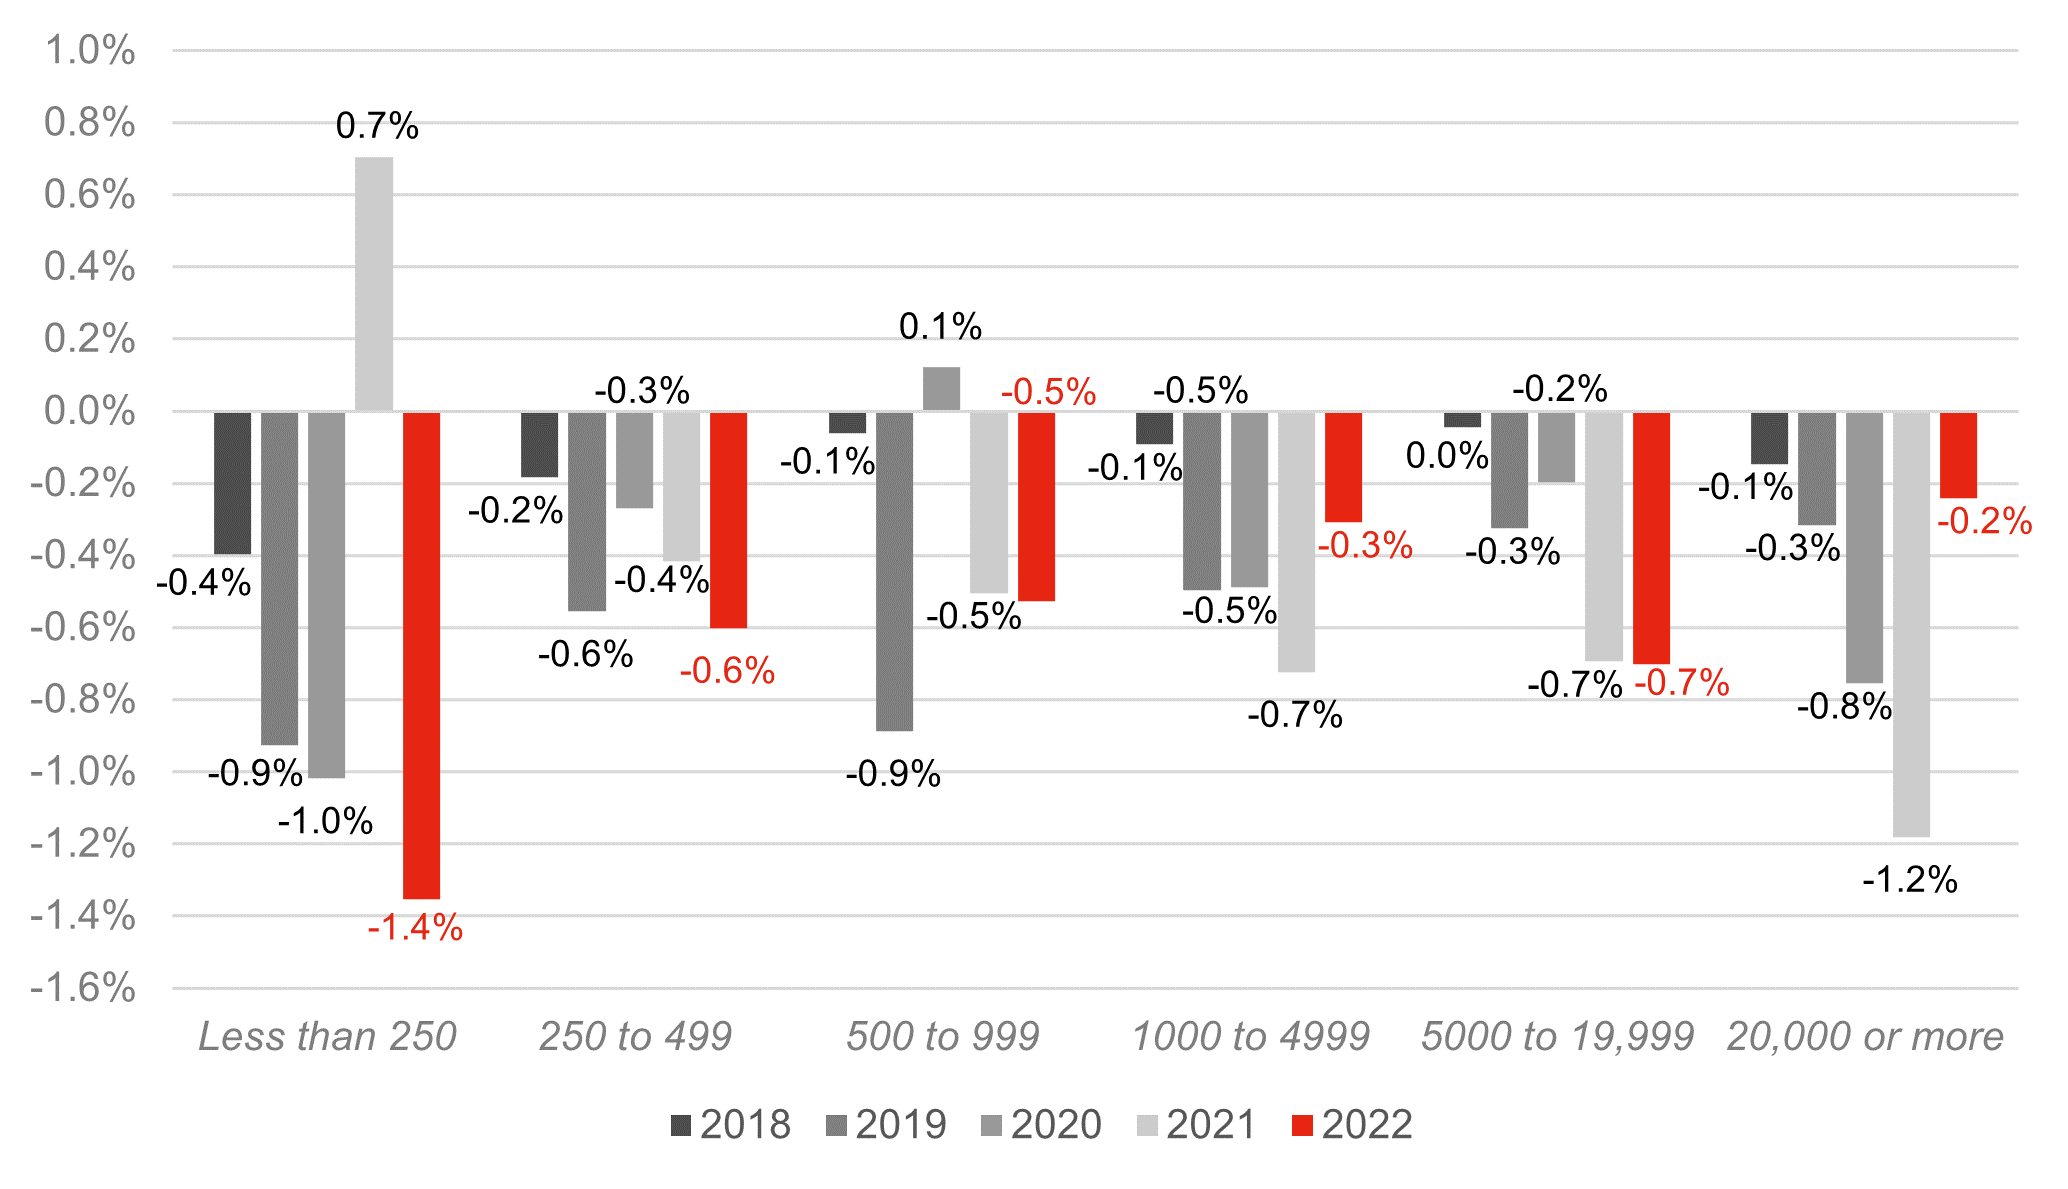
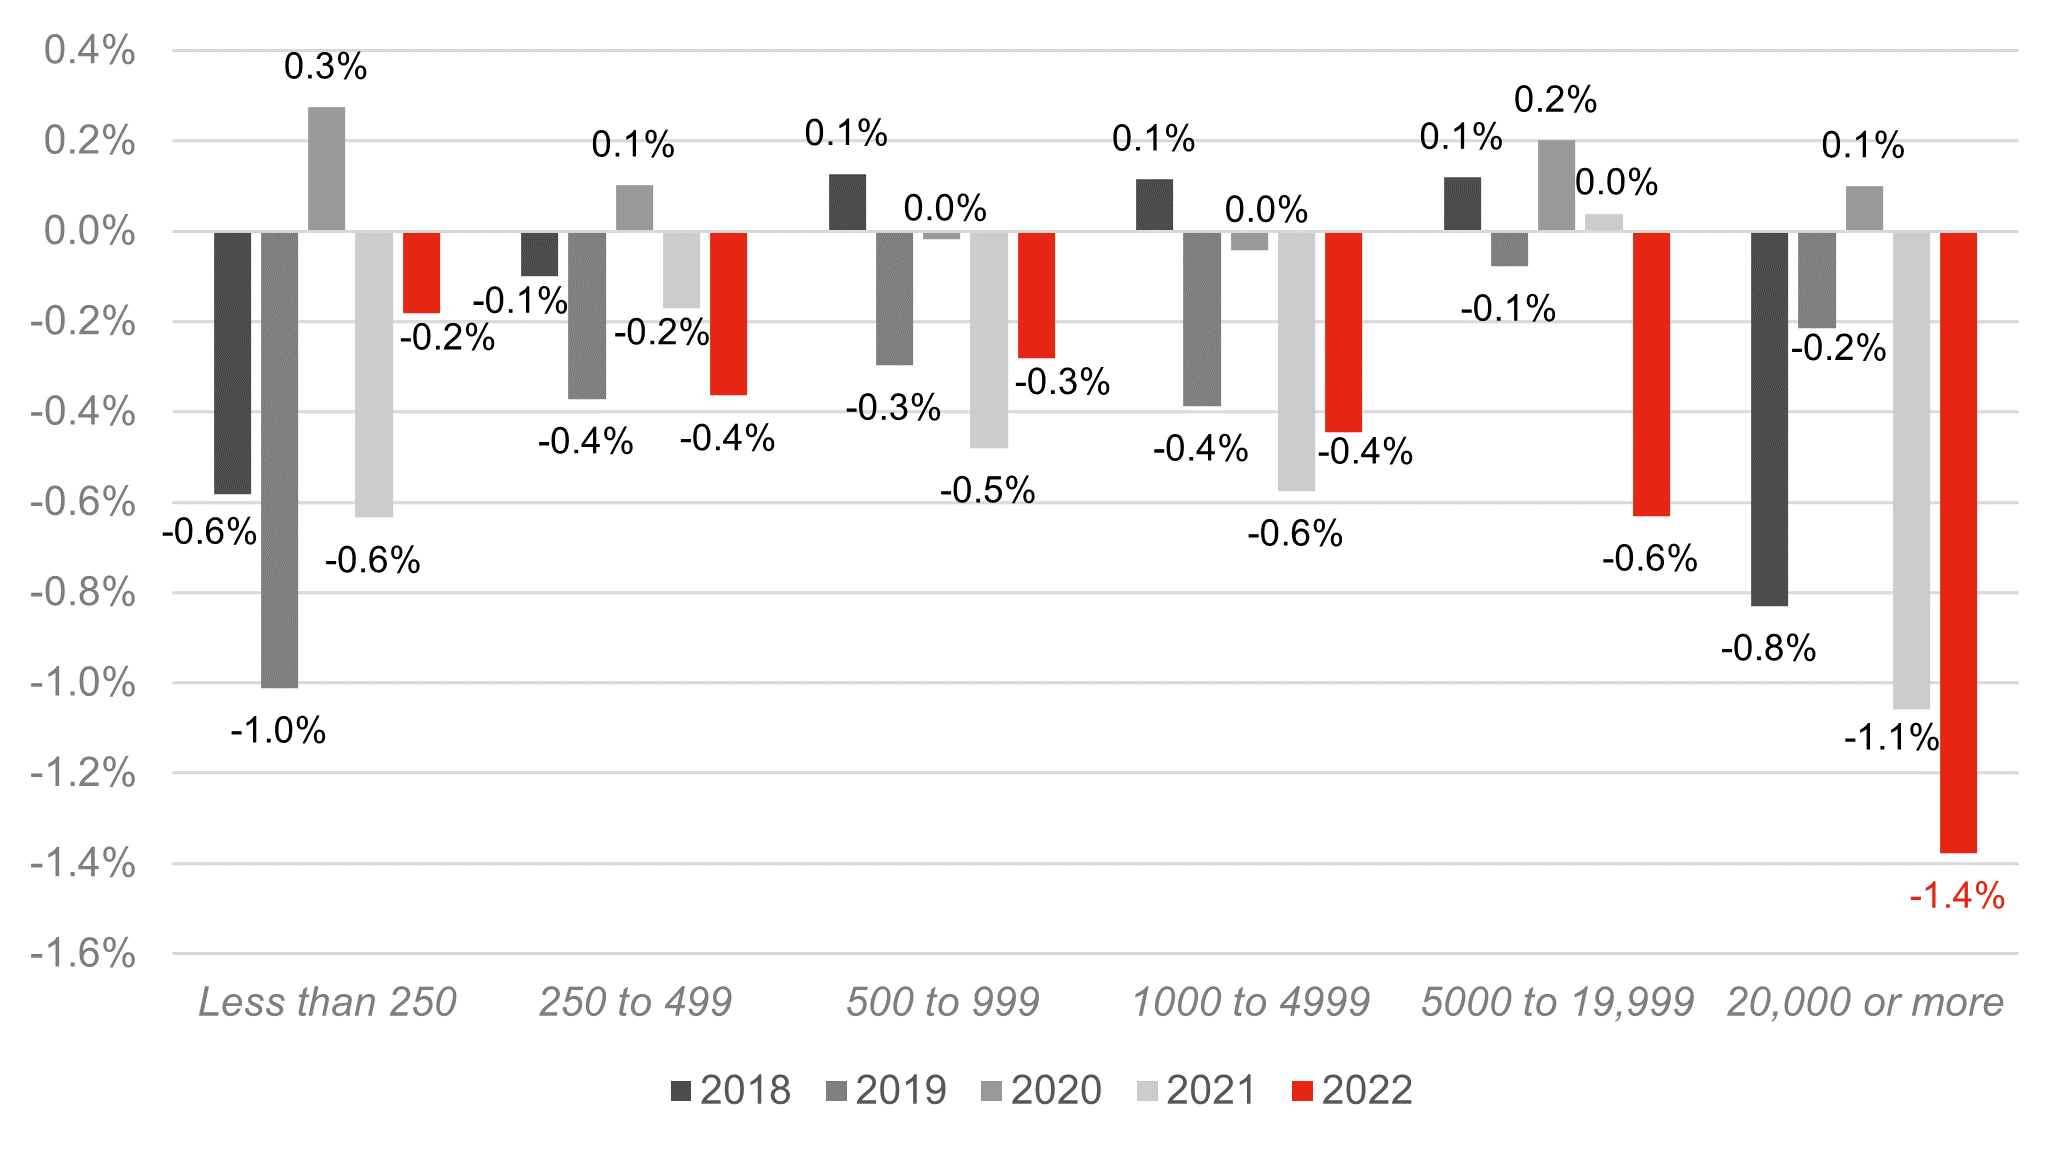
The charts below show that the biggest employers have seen, on average, the smallest changes to the mean pay gap this year but the largest changes to the median pay gap. Why might this be?
Mean change in mean gender pay gap by employer size
Mean change in median gender pay gap by employer size
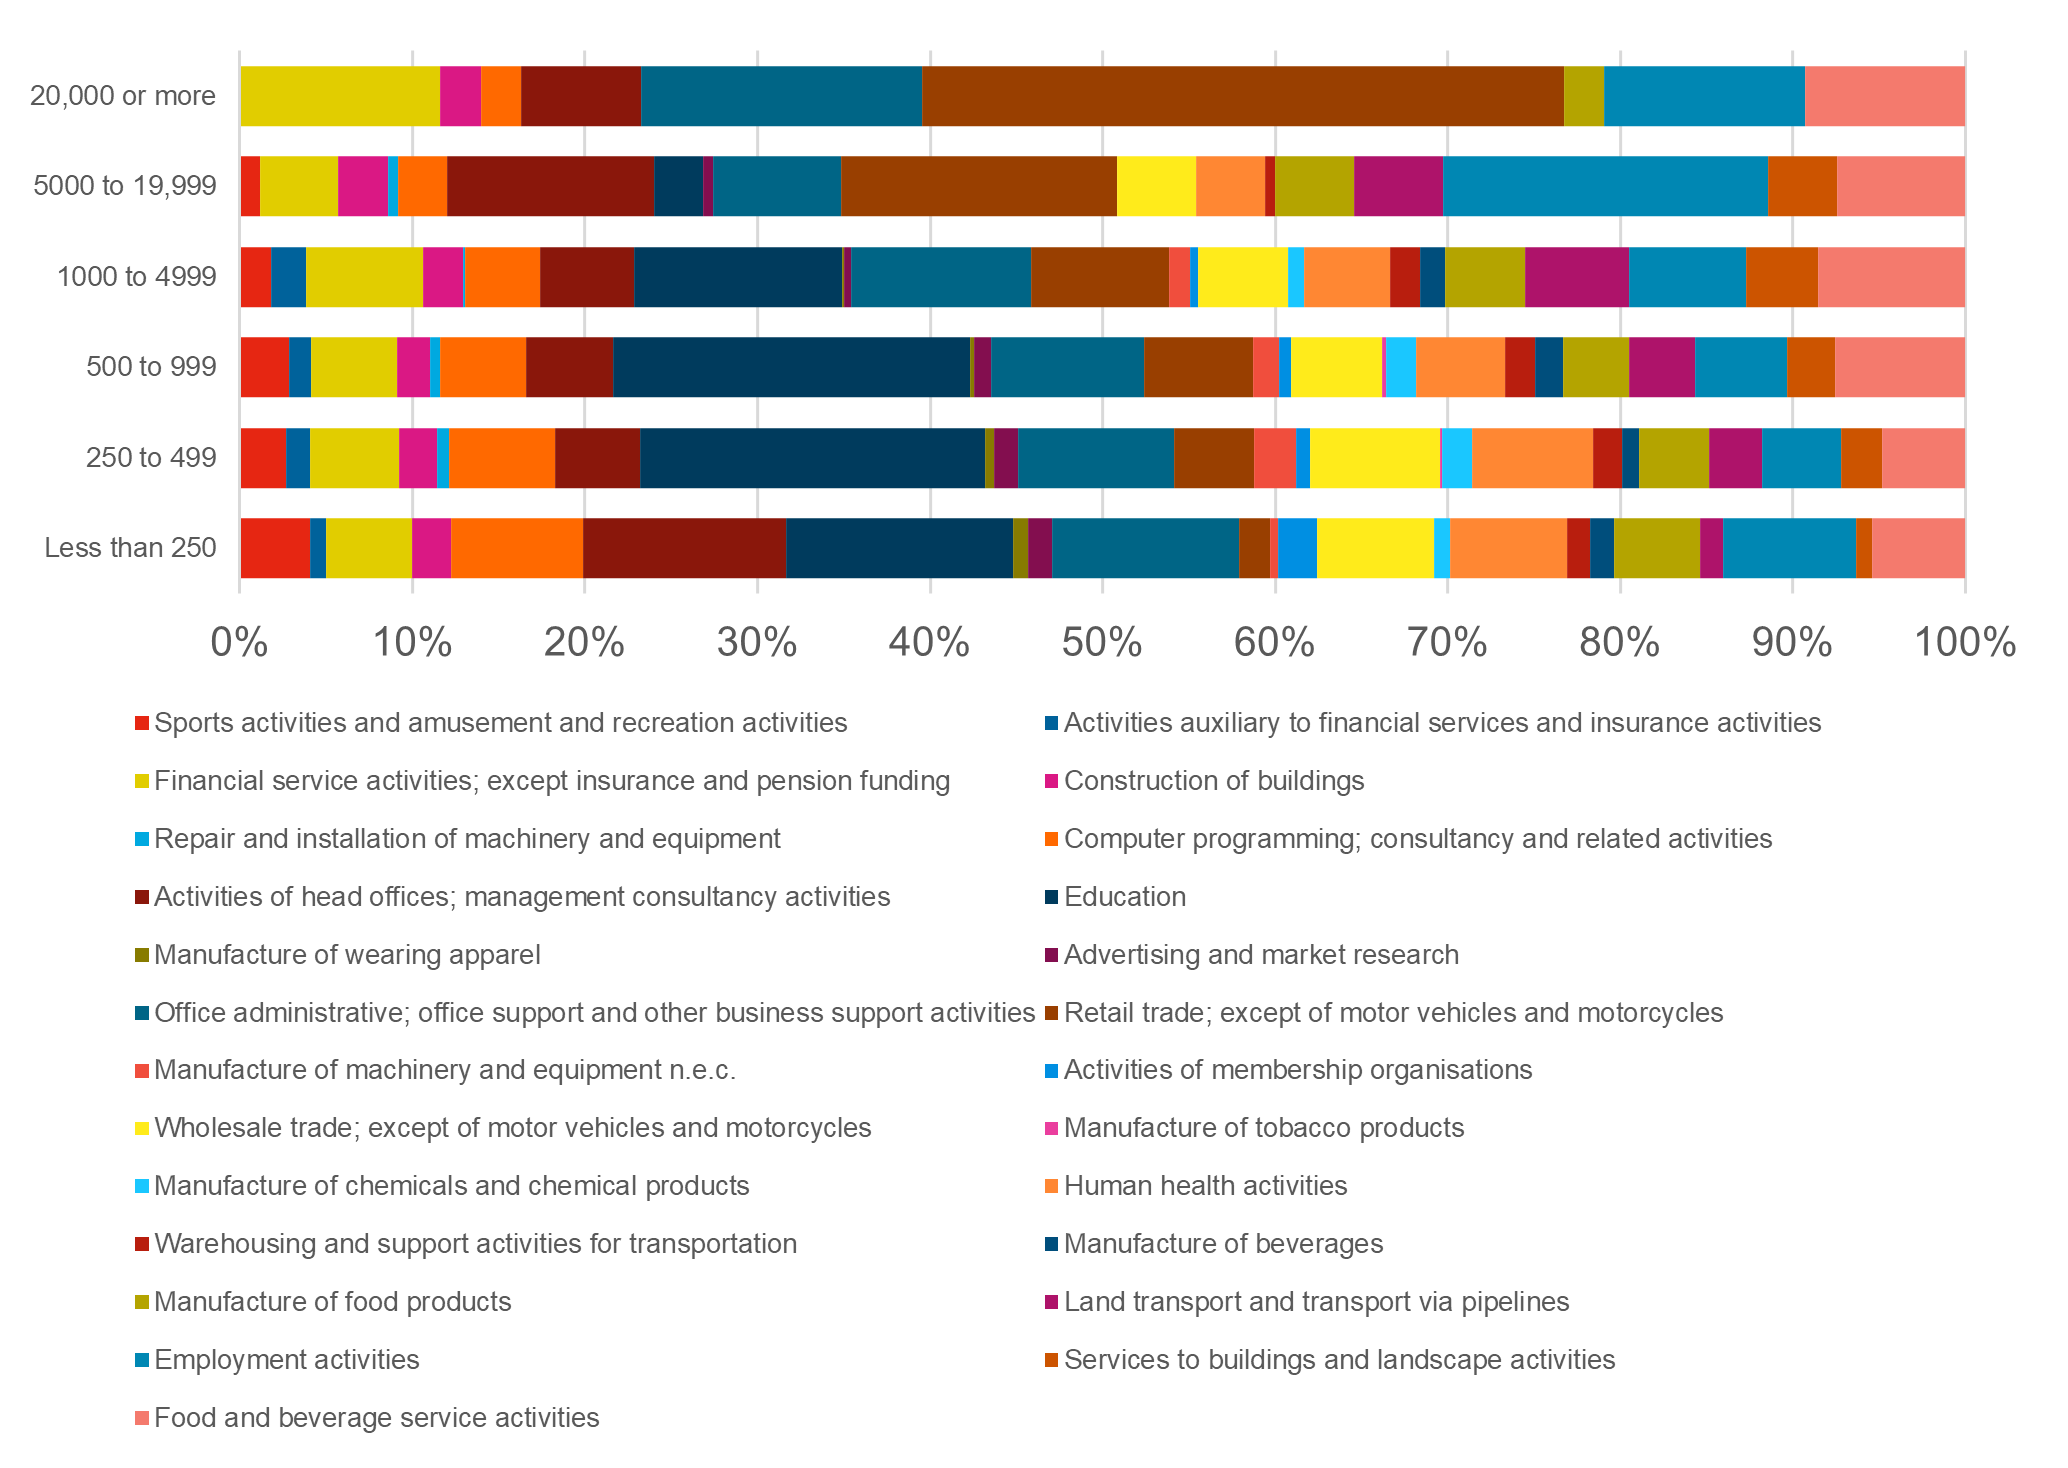
To figure out the answer to this question, we looked at the differences between the largest employers and the rest. The chart below shows a breakdown of employers by sector and size. This analysis shows that the largest employers are much less representative than others: 37% of the biggest employers are in the retail sector. When we broke the data down further and looked at gaps by sector and size, we found that restaurants with 20,000+ employees have seen the biggest changes in their gender pay gaps: mean and median pay gaps are 9.5% and 7.9% lower respectively. Most of this comes from a single employer: JD Wetherspoon. Its mean and median gender pay gaps fell from around 30% in 2021 to just 3% in 2022. In 2021, over 36,000 of its employees were furloughed and its gaps calculated from just 168 remaining employees, so its gaps returned to a more realistic level.
Furlough and the pandemic will have affected all figures to some degree, but potentially the largest companies the most.
Sector breakdown of employers by size
Gender pay gap reporting and small businesses: greater variation
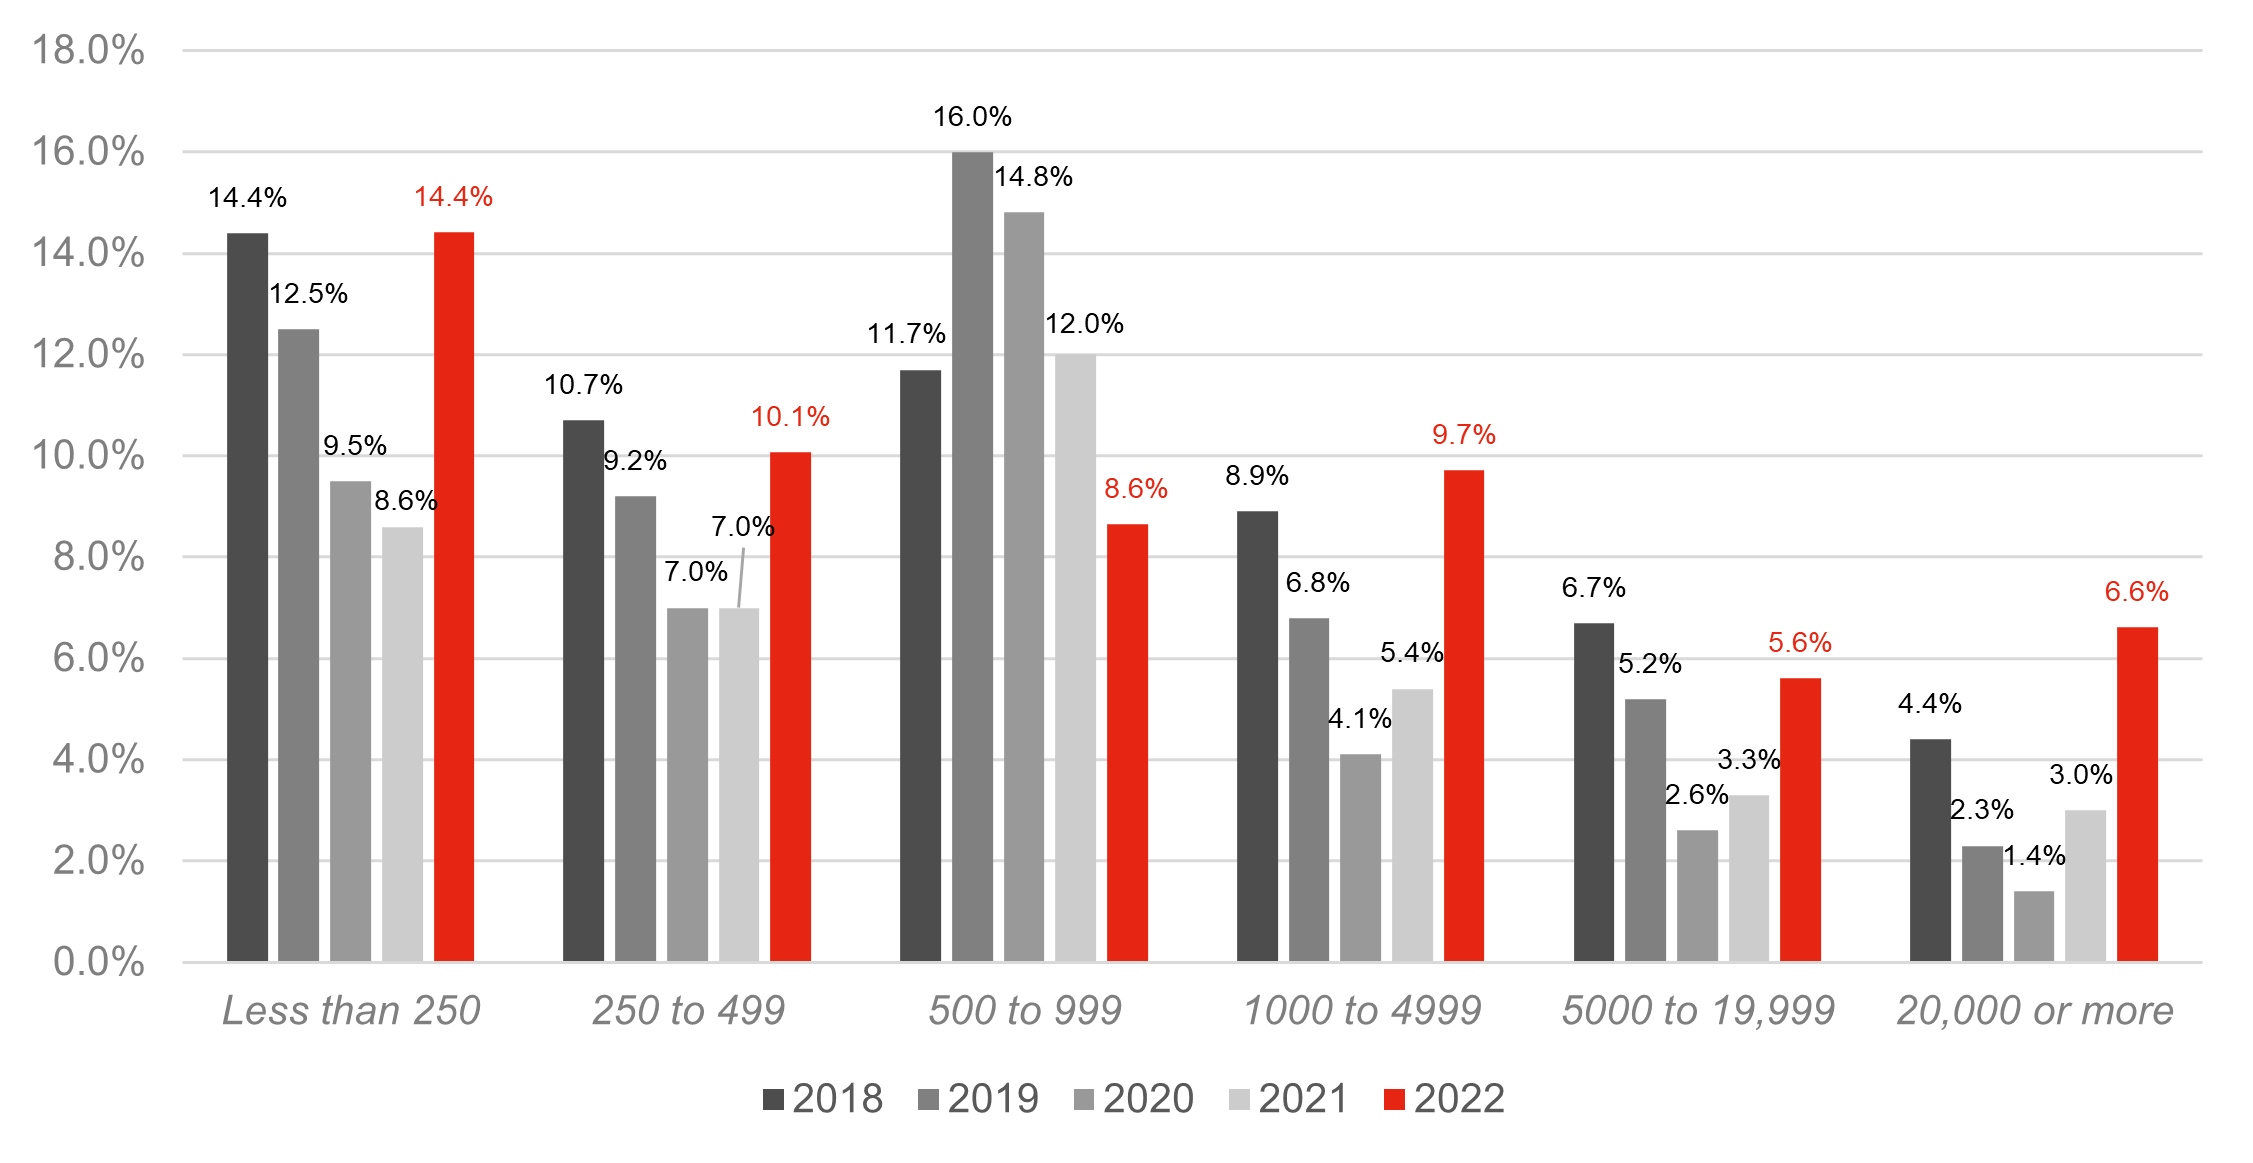
We have discussed previously in our article on gender pay gap reporting and small businesses how smaller employers will see greater change in their gender pay gaps and our analysis this year (and last) proves this. The charts below show how standard deviation (a measure of variability, as mentioned above) is higher for smaller companies.
Companies of all sizes (with those with 500-999 employees being a notable exception) had a greater standard deviation in 2022 than in 2021. There was more overall variation in the data than in previous years. Again, furlough and the pandemic might be to blame. This year’s figures are the first “normal” ones since 2019, so we would expect the degree of change to be greater.
Standard deviation of change in mean pay gap by employer size
Standard deviation of change in median pay gap by employer size
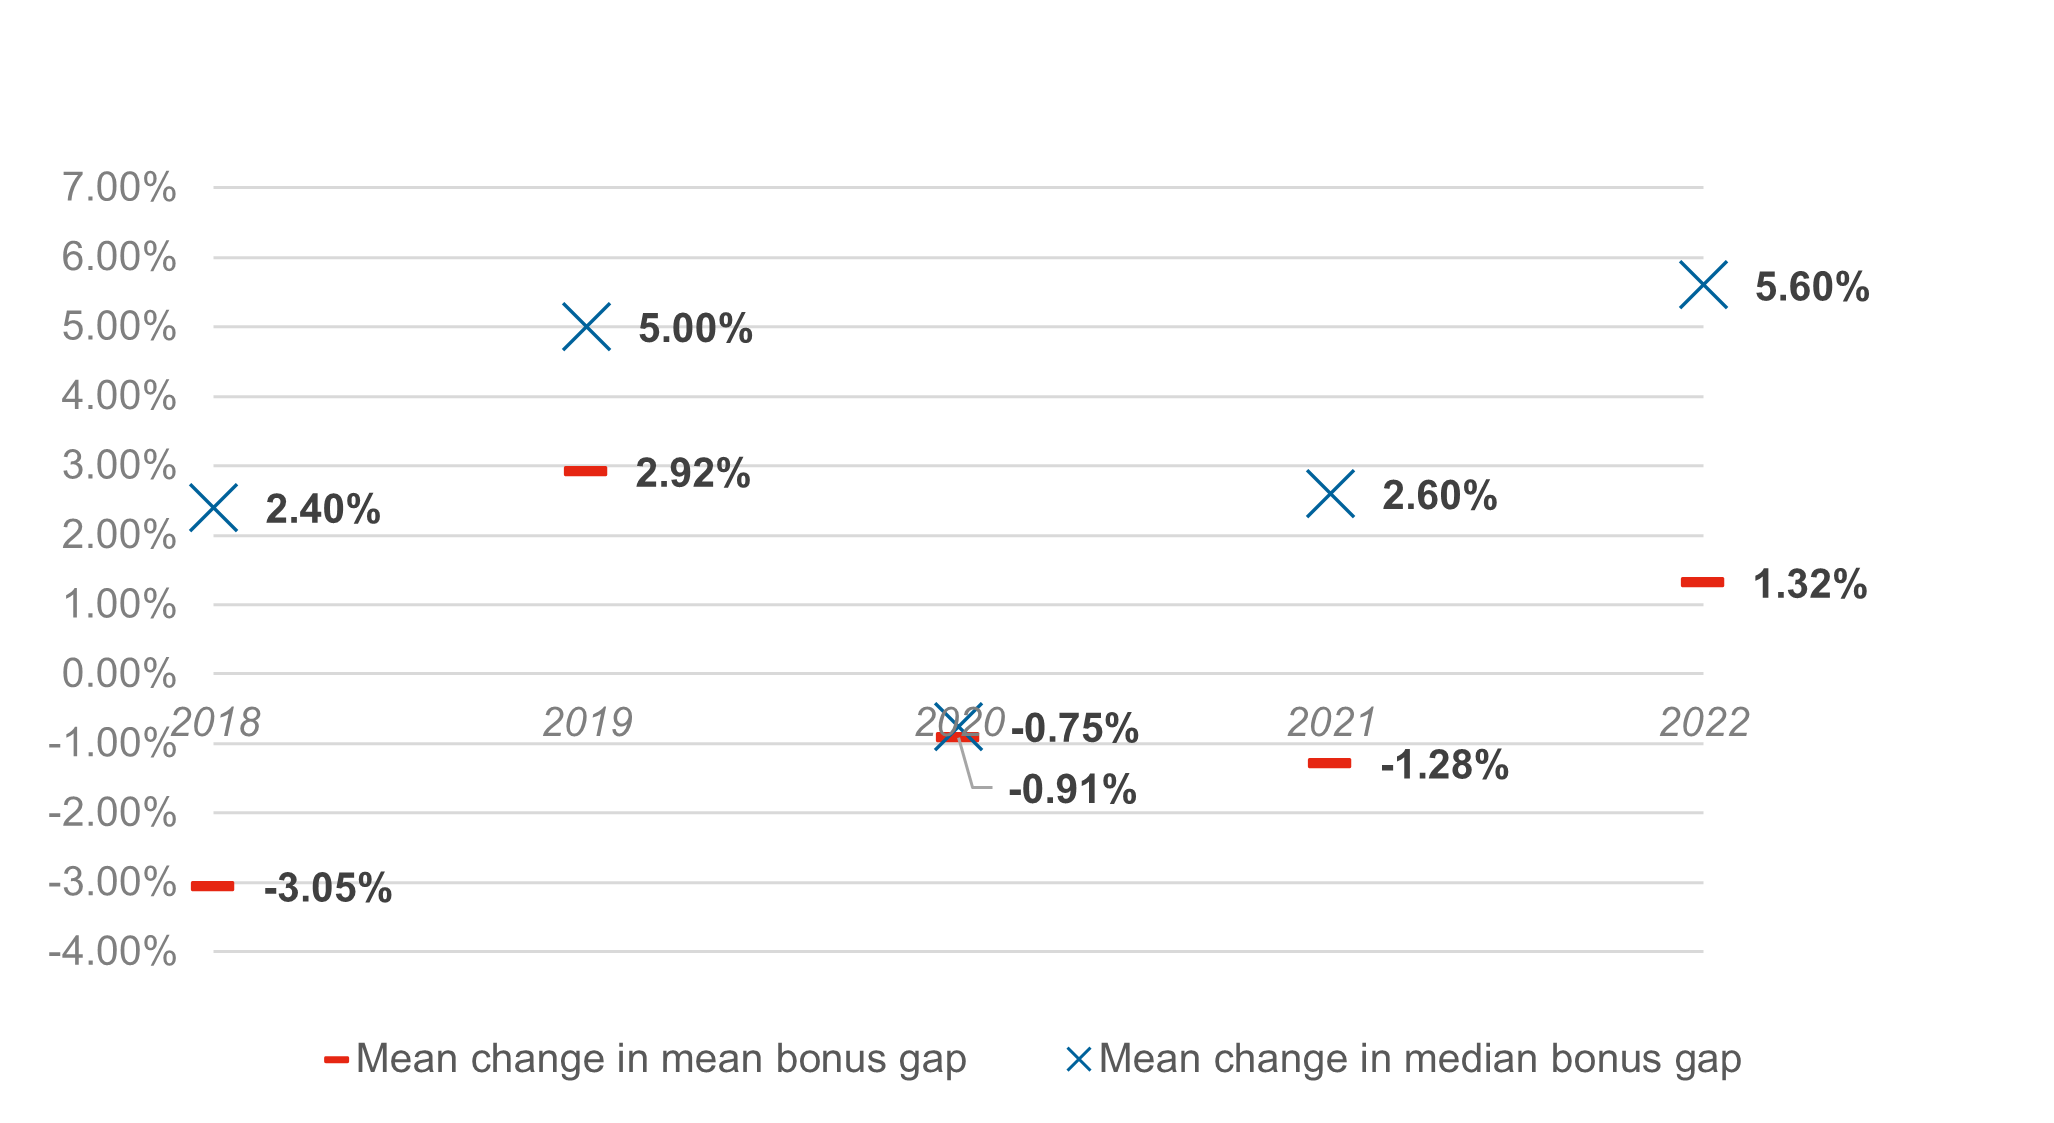
Bonus gaps in 2022
As last year, bonus gaps are again affected by Covid. This year’s figures are calculated from all bonuses paid in the period from 6 April 2021 to 5 April 2022, and so they may relate to work done even earlier and in the dark depths of the pandemic. For example, an annual bonus paid at the end of April 2021 is likely to be based wholly or mostly on performance in 2020. This means that, even next year, the pandemic will continue to affect bonus gaps.
As in 2021, mean and median bonus gaps have risen. Bonus gaps are calculated only from those that received a bonus. By adding or removing lots of low value bonuses, the pool used in the calculation can change and this affects the overall gaps.
These bonus gaps cover a large amount of the pandemic period. During these difficult times, employers took different approaches as they tried to survive. Some had to remove low value bonuses to save money, whereas others were able to take the opposite approach and made special “covid bonuses” to reward employees during difficult times. These different approaches have impacted bonus gaps.
Mean change in mean and median bonus gap
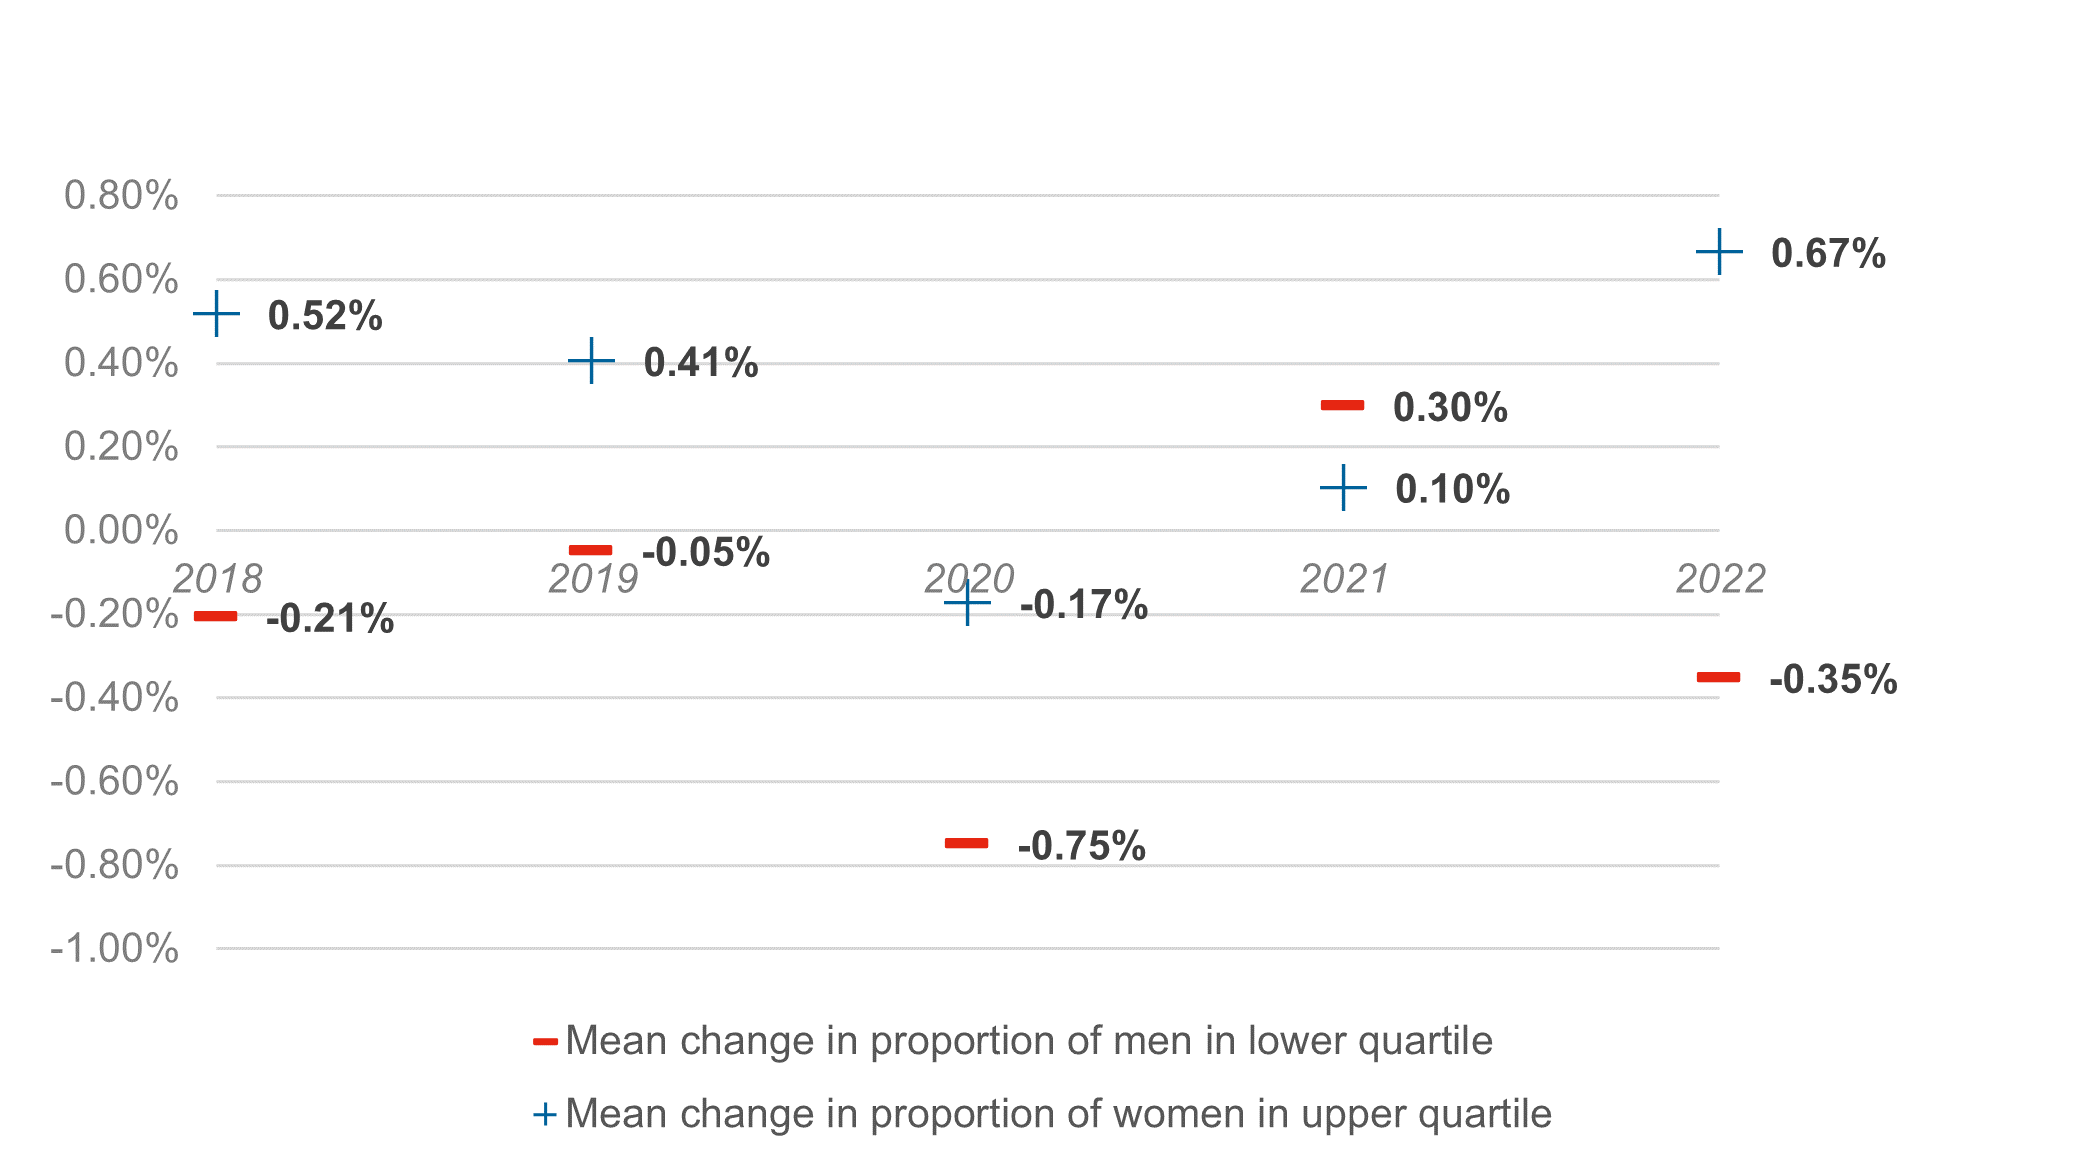
Quartiles: proportion of men and women in highest and lowest paid roles
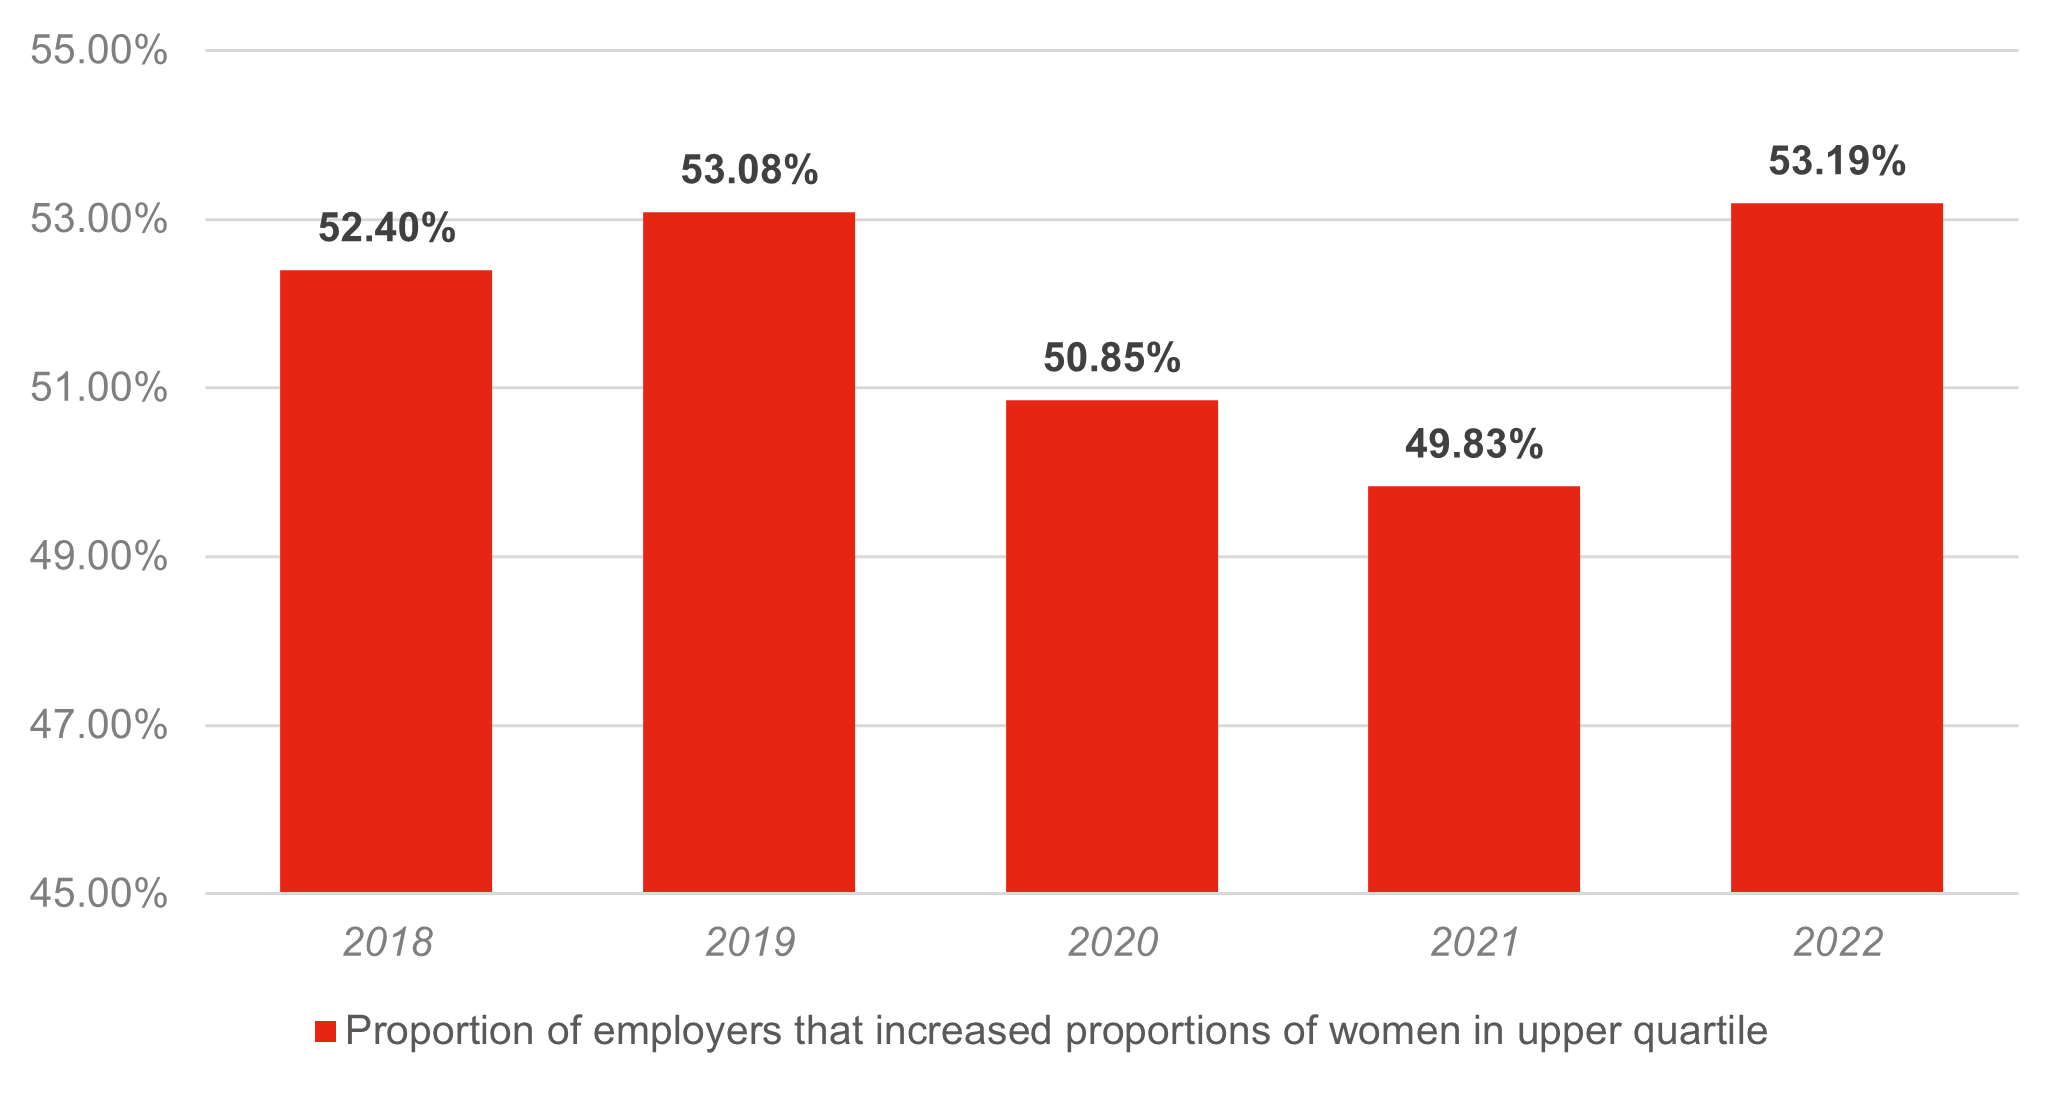
In 2022, employers on average increased the proportion of women in the highest paid (upper) quartile by nearly 0.7%. This is the biggest change since gender pay gap reporting began; over 53% of employers saw an increase in the proportion of women in the highest paid (upper) quartile. Getting more women into the most senior and best paid roles is a key part of any employer’s objective of reducing a gender pay gap and addressing a lack of diversity in those roles.
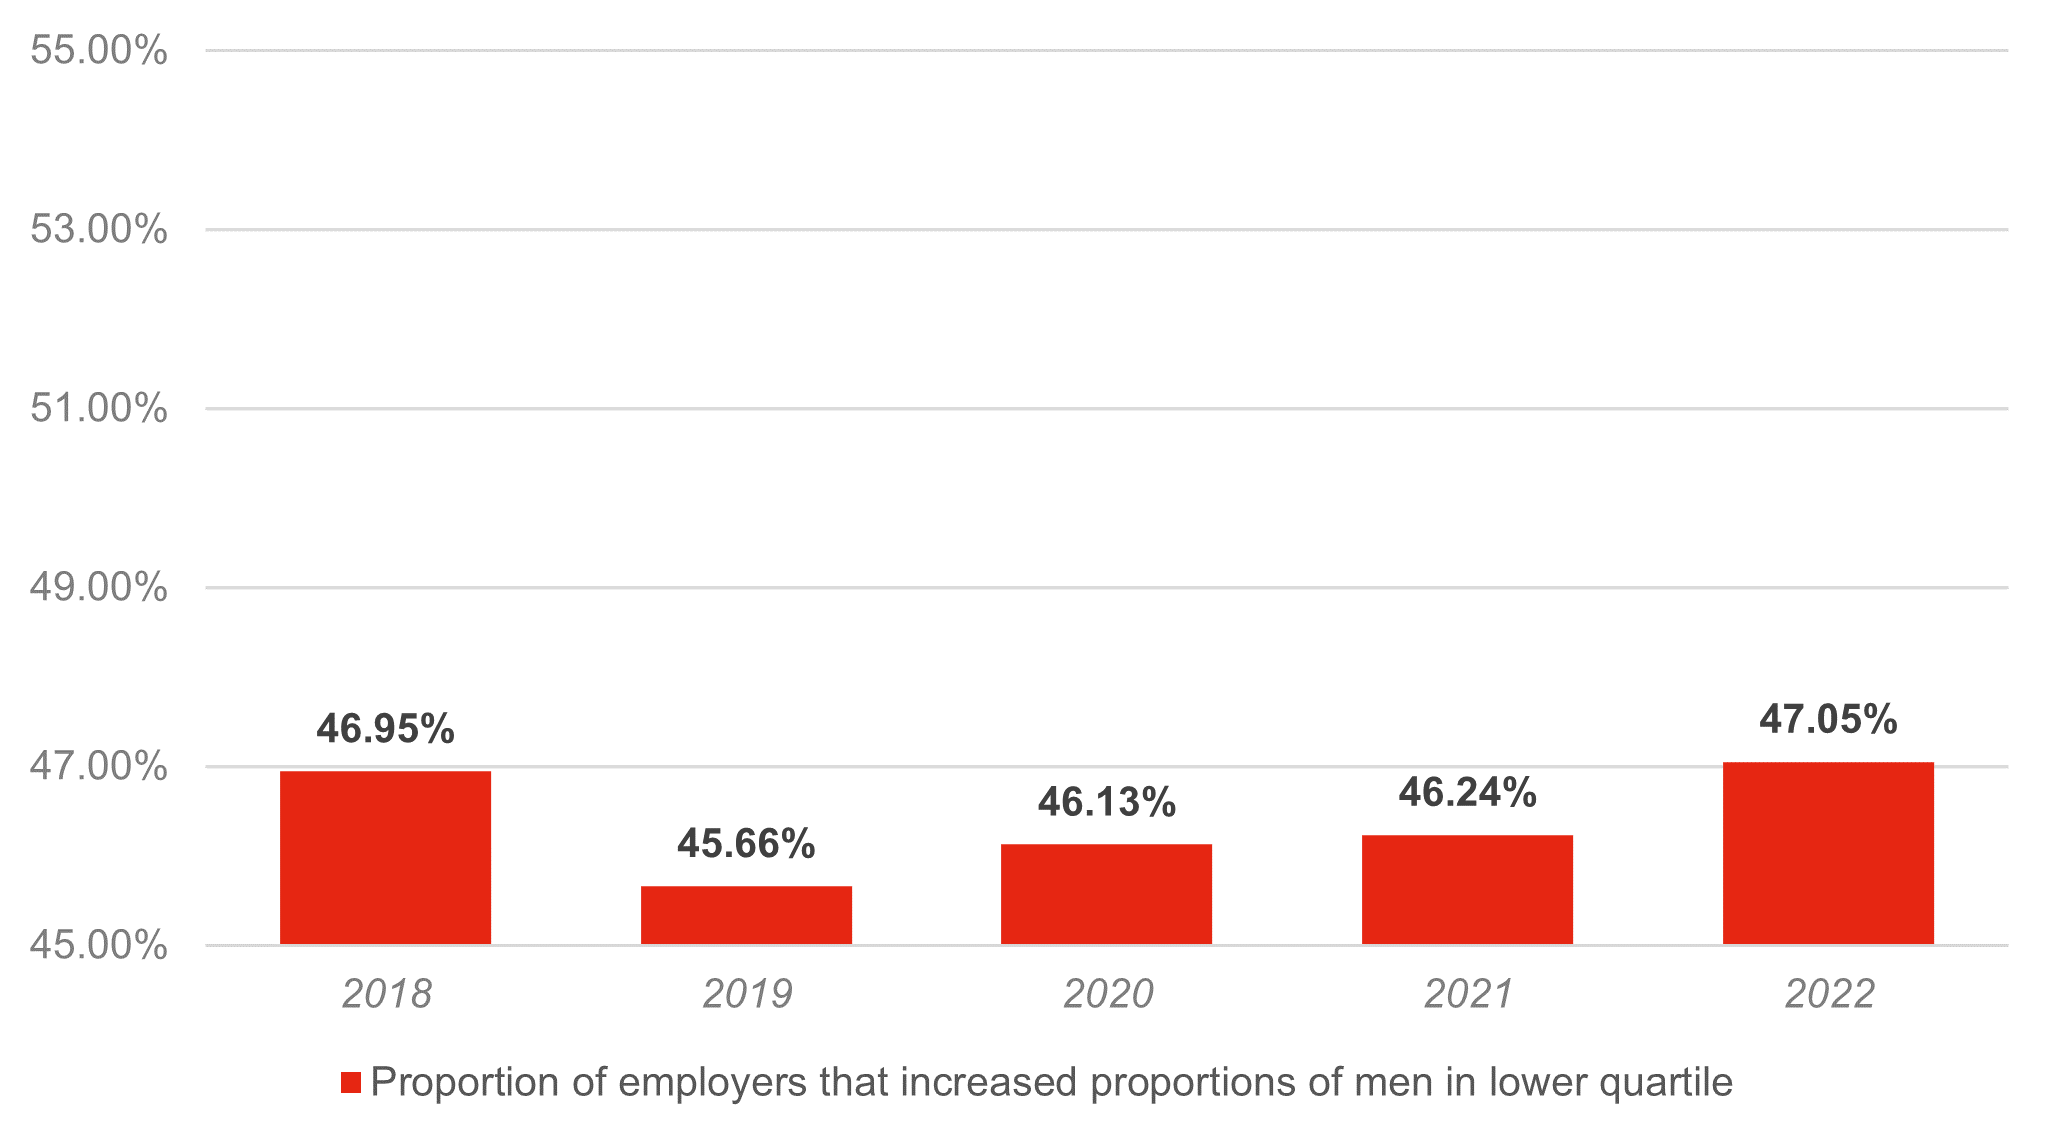
Most employers will make this a focus of their strategy to reduce their gender pay gaps. But we find that many omit a vital piece of the pay gap puzzle: the lowest paid (lower) quartile. Increasing the proportion of men in the lower quartile would also reduce gender pay gaps, and because these roles tend to have highest turnover and lowest barriers to entry, it can often be the quickest “win” when it comes to reducing gaps.
In 2021, the data suggested that employers might be catching on to this idea.. For the first time, there was (on average) a small increase in the proportion of men in the lower quartile. However, 2022’s figures continue the pattern of the pre-2021 years suggesting that 2021’s results might just be an anomaly. Overall, there was a fall in the proportion of men in the lowest paid jobs in 2022 although the proportion of employers that saw an increase did rise (to over 47% of employers). .
Mean change in proportion of men and women in upper and lower quartiles
Proportion of employers that increased women in upper quartiles
Proportion of employers that increased men in lower quartile
We help dozens of employers each year with gender pay gap reporting. Find out more about our services or contact us.
Related items

Tom Heys comments for Bloomberg on Gender Pay Gap reporting figures
05 April 2023Tom Heys has commented in an article for Bloomsburg discussing gender pay gap reporting and the most recent set of statistics published by employers.
Gender pay gap reporting
04 March 2016Affecting all employers with more than 250 employees, the new rules will require website publication of various statistics showing the difference in mean and median pay between male and female employees. This session will take you through the detail of the draft proposals and the practical implications.